⚠ This is an
archived version of our Community Check Box help documentation.
Please find our most up to date documentation at
Community Check Box Help.
Managing Indicators
Indicators are objective, population-level measures that can be useful in understanding community trends and assessing the impact of collective community action on longer-term outcomes in a community.
Indicators can be graphed on their own to determine changes in the measure over time, or they can be graphed together with Accomplishments to determine if there is a correlation between the level of Accomplishments and changes in the Indicator. Information from the Indicator database can also be exported into Microsoft Excel for further analysis.
Indicator Overview
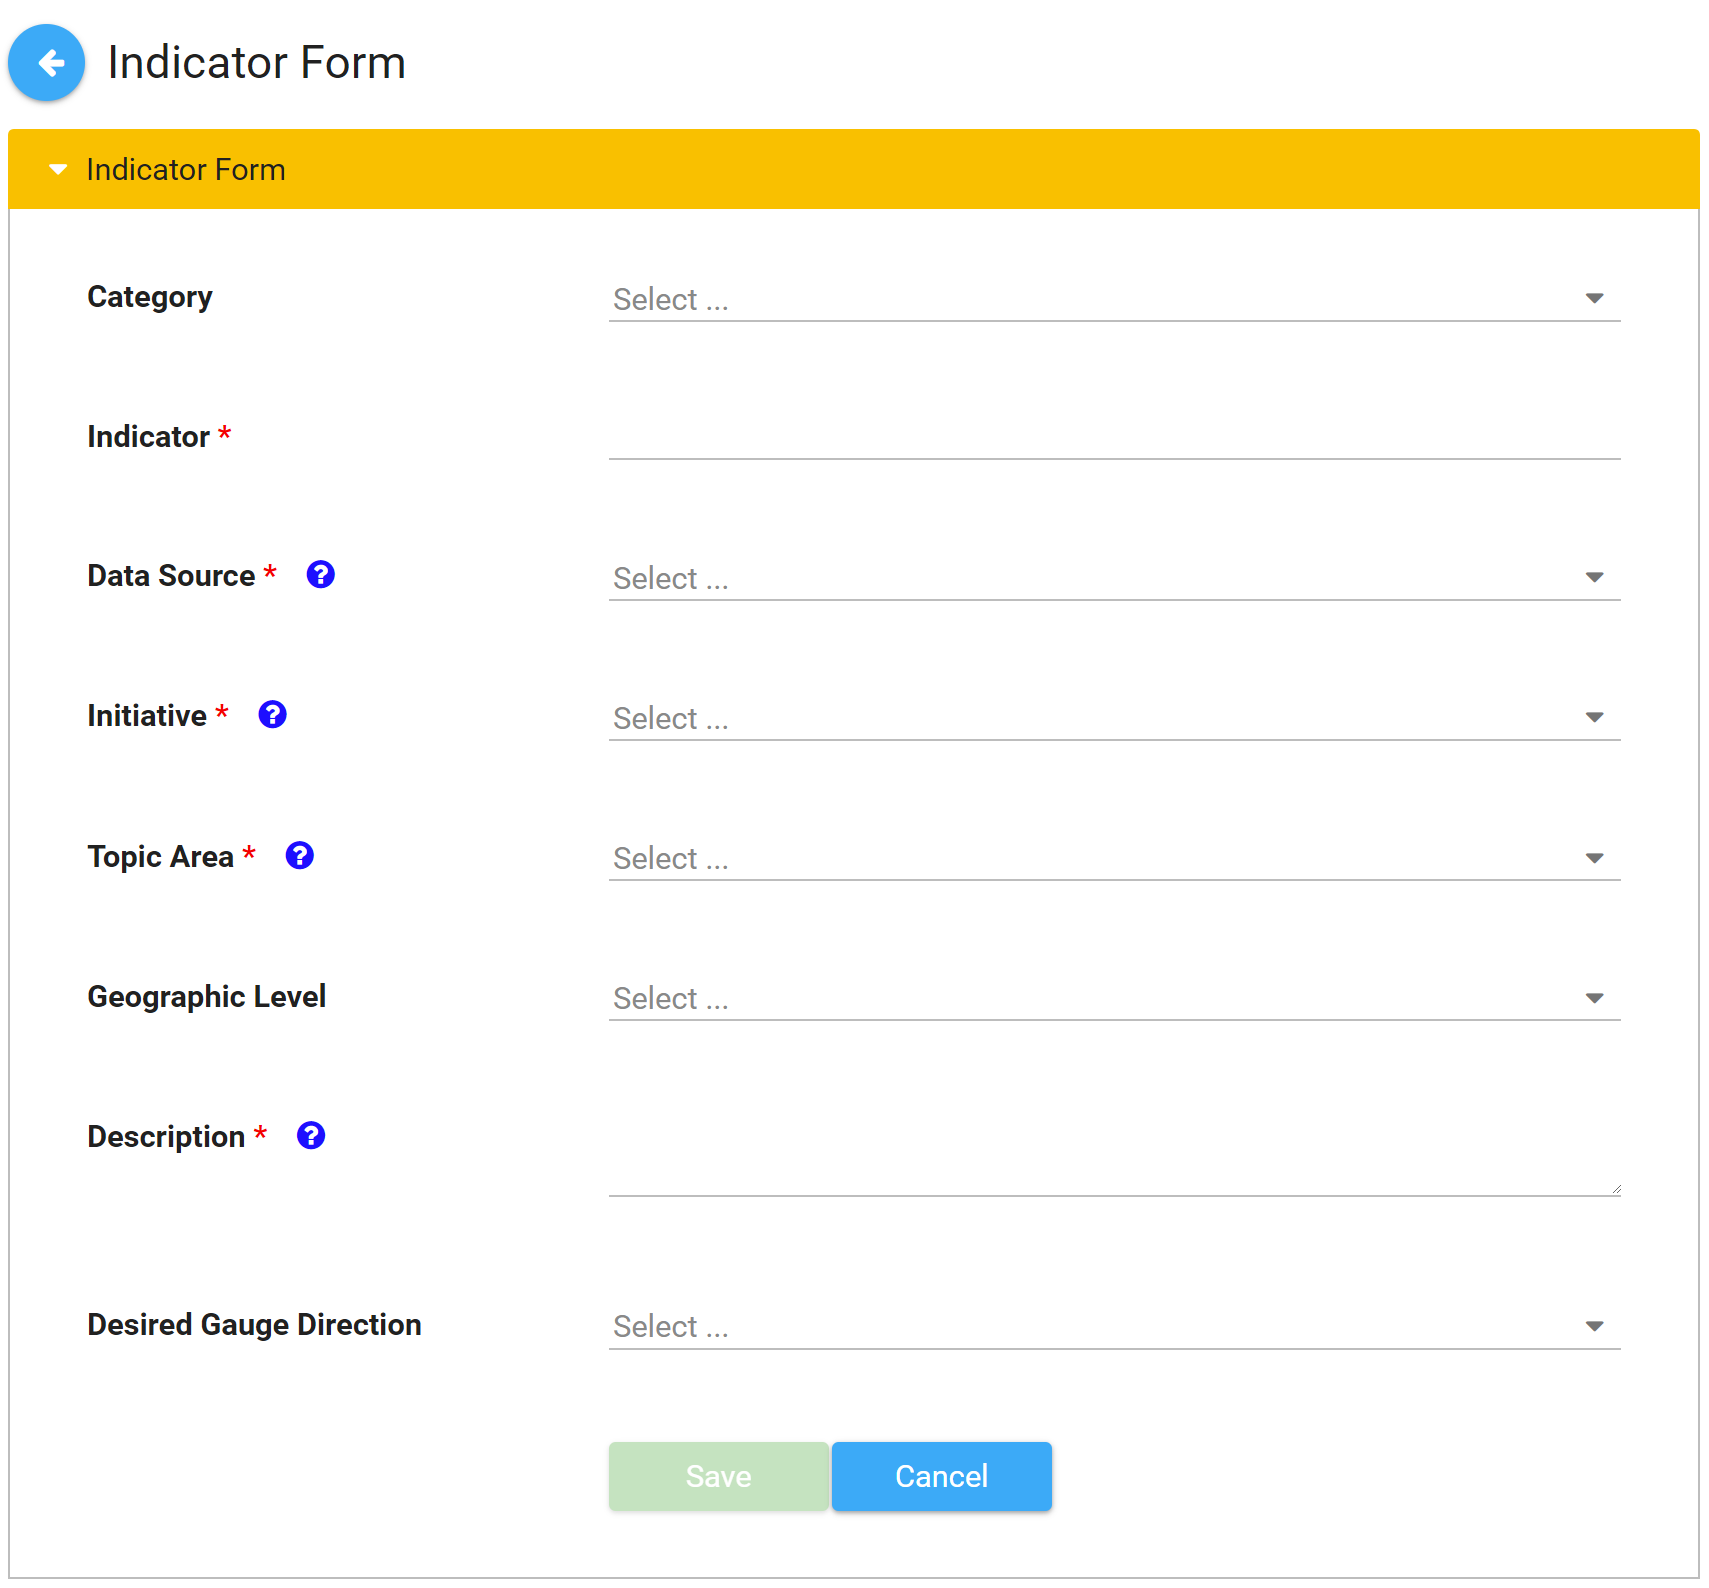
Each Indicator includes several fields for specific information about the Indicator. These fields include:
-
Indicator: The specific Indicator of interest (e.g., percent of Kansas 10th graders reporting "yes" to 30-day use of alcohol in 2010).
-
Data Source: The source of the data that you are entering (e.g., Dept. of Health and Human Services, U.S. Census, Behavioral Risk Factor Surveillance System, etc.).
-
Initiative: The specific initiative to which the Indicator is related.
-
Topic Area: The category that the Indicator relates to (for example, Health Behaviors, Substance Abuse Prevention, Preventive Care, etc.).
-
Indicator Description: This provides more detailed information about the Indicator and what it represents.
-
Geographic Level: This box allows you to select at what geographic level the Indicator is taking place – City, State, a specific Zip Code, County, or Census Tract. You can also choose to enter a specific address. Your project also has the option to add a custom geographic level, if the Indicator is not taking place in one of the specified options.
These fields will always be included in the Indicator, and individual projects also have the option of adding five additional fields that are customized to the information they would like to collect.
In addition to the standard fields listed above, there are optional fields that you can choose to customize for your project.
Create a new Indicator
NOTE: Users rarely need to create new indicators. That task is usually done by KU staff or the Site Owner/project lead. If you want to enter new data,or edit existing data, please go to Add new Indicator data or Edit existing Indicator data sections.
There are two ways to create a new indicator. - If you want to create an indicator from existing categories, data sources, etc.,
- Go to Indicators and click Indicators and then New Indicator.
-
If you need to create new categories, etc.
-
Go to
Administration then select Indicators.
Instructions for Indicators > New Indicator.
- Click + New
- Select options for fields shown.
- Enter numerical range for Yellow Gauge. For example, if you want entries <30 to be green, and >40 to be red, you would enter 30 and 40 for the yellow gauge.
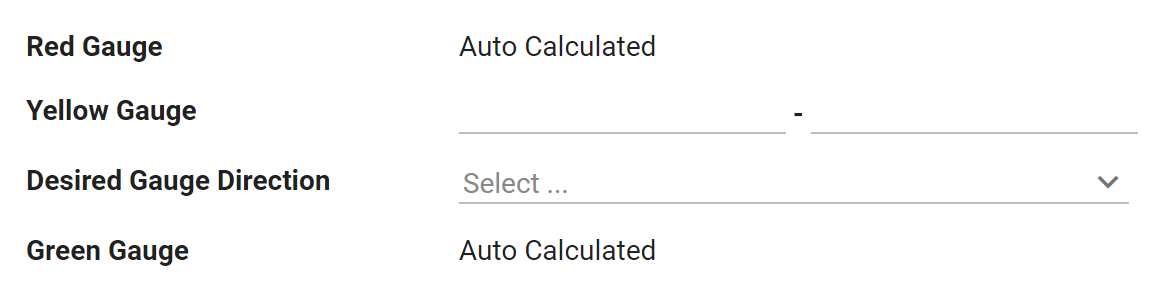
- Click Save.
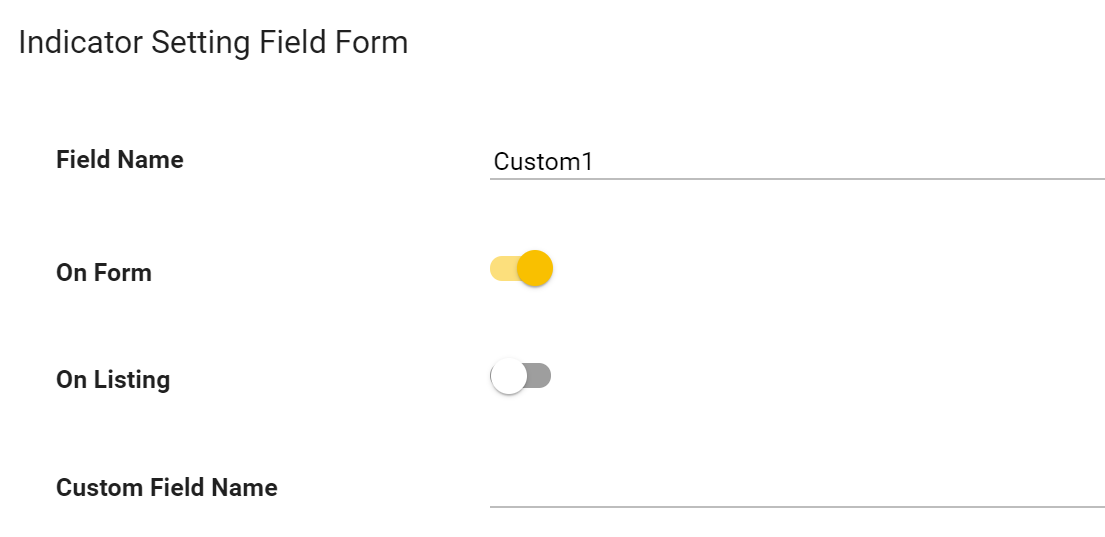
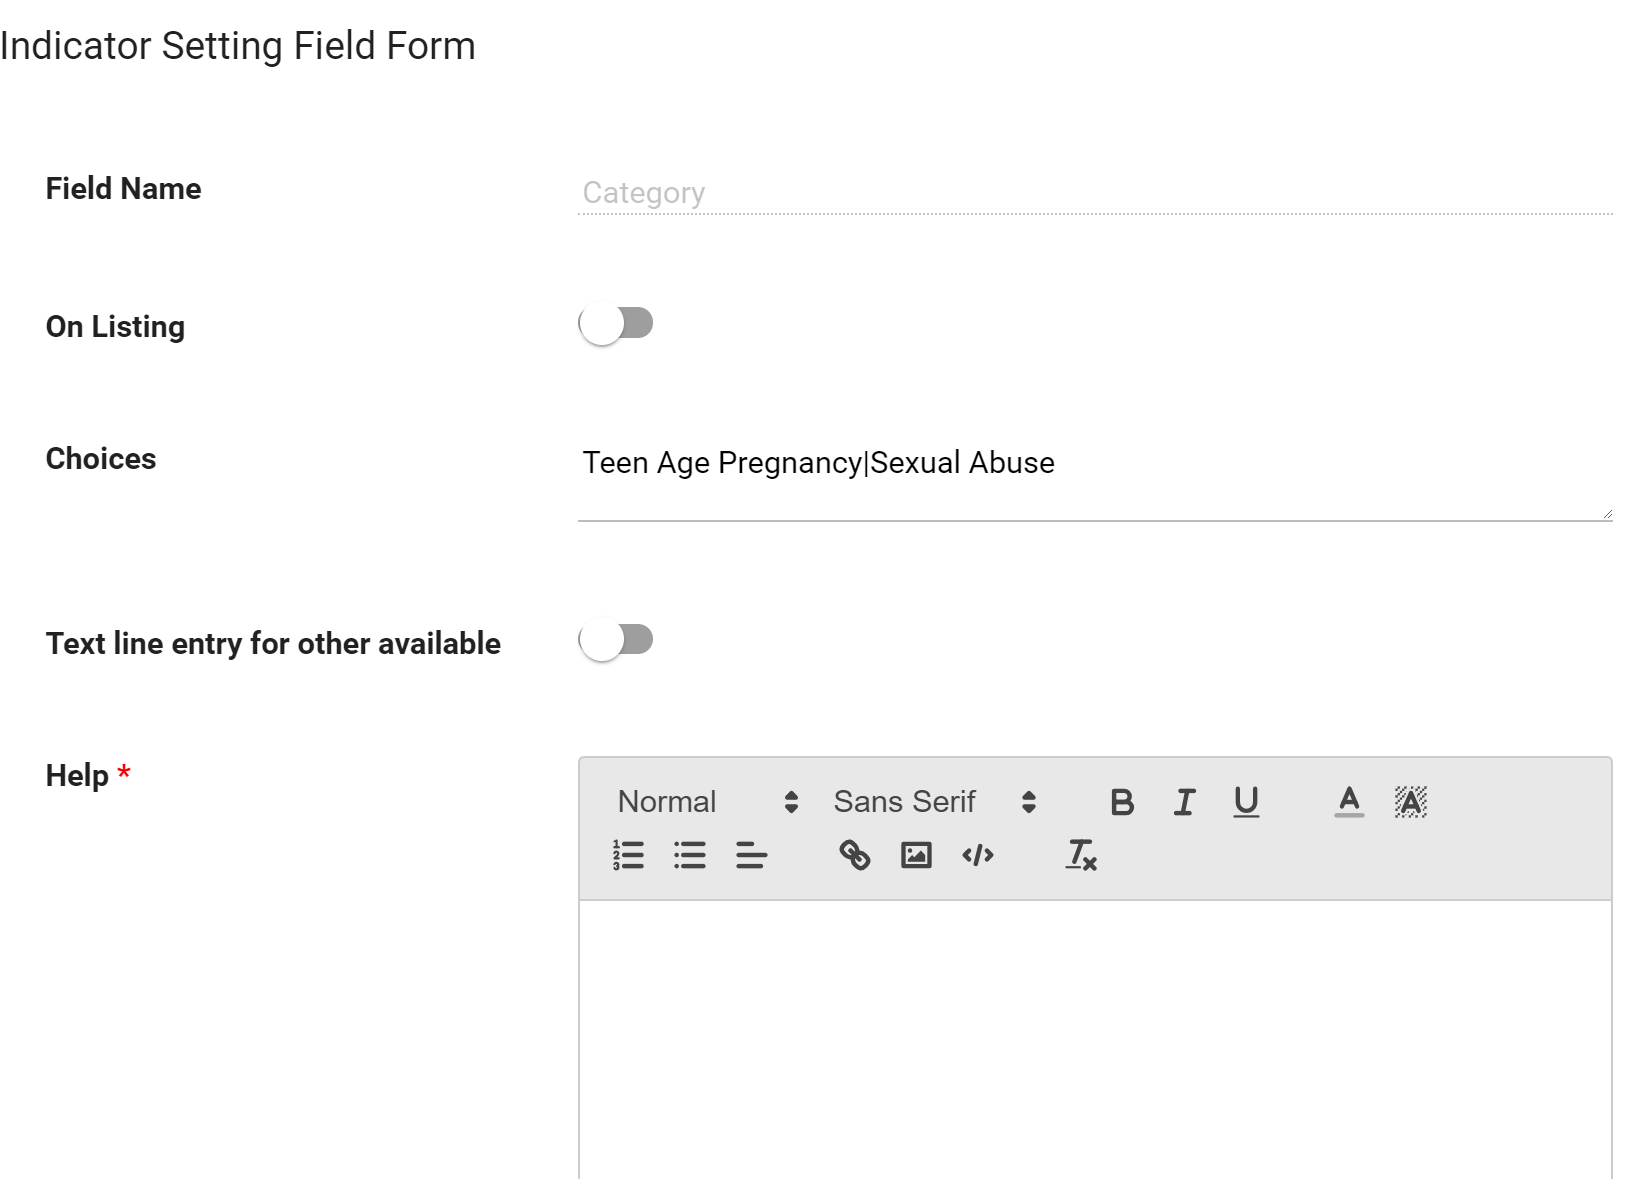
Instructions for Administration > Indicator
- Click on
Administration then
Indicator.
- Click on
Category.
- Select
On Listing if you want this field to display on the listing.
- Add
Choices.
Be sure to use the "|" between the choices. This character is called a pipe, and is on the same key as the forward slash. Make sure that you do not include any spaces between choices, e.g., Choice 1|Choice 2|Choice 3.
- Select
Text line entry for other available if you want to use that option.
- Enter any
Help text.
-
Save.
-
Repeat for each field you need to use.
- If you do not want to use the custom fields, open each one and unselect the "On Form" option.
If you forget to do this, your indicator form will display a series of blank lines with red dots.