⚠ This is an
archived version of our Community Check Box help documentation.
Please find our most up to date documentation at
Community Check Box Help.
Indicators
Indicators are objective, population-level measures that can be useful in understanding community trends and assessing the impact of collective community action on longer-term outcomes. Indicators provide broad markers to help assess the impact of your work on longer-term outcomes in your community.
Illustrative examples of Indicators:
- Perceived availability of alcohol by youth
- Employment rates
- Infant mortality rates
- Voter turnout
- Number of low birth-rate babies
- Amount of youth participation
- Violent crime levels
Indicators can be graphed on their own to determine changes in the measure over time, or they can be graphed together with Accomplishments to determine if there is a correlation between the level of Accomplishments and changes in the Indicator. Information from the Indicator database can also be exported into Microsoft Excel for further analysis.
Indicator Overview
Each Indicator includes several fields for specific information about the Indicator. These fields include:
-
Category: The category names for your Indicators.
-
Indicator: The specific Indicator of interest (e.g., percent of Kansas 10th graders reporting "yes" to 30-day use of alcohol in 2018).
-
Data Source: The source of the data that you are entering (e.g., Dept. of Health and Human Services, U.S. Census, Behavioral Risk Factor Surveillance System, etc.).
-
Initiative: The specific initiative to which the Indicator is related.
-
Topic Area: The category that the Indicator relates to (for example, Health Behaviors, Substance Abuse Prevention, Preventive Care, etc.).
-
Description: This provides more detailed information about the Indicator and what it represents.
- Gauges: You can enter the
-
Geographic Level: This box allows you to select at what geographic level the Indicator is taking place – City, State, a specific Zip Code, County, or Census Tract. You can also choose to enter a specific address. Your project also has the option to add a custom geographic level, if the Indicator is not taking place in one of the specified options.
These fields will always be included in the Indicator, and individual projects also have the option of adding five additional fields that are customized to the information they would like to collect.
Your site owner should have already set up Indicators for you. If you don't see any Indicators or need to add a new one, please check with your site owner.
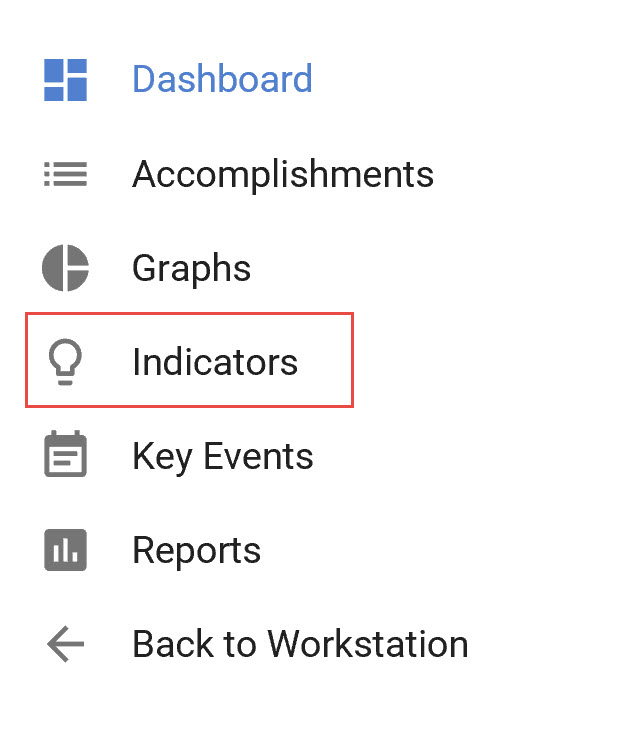
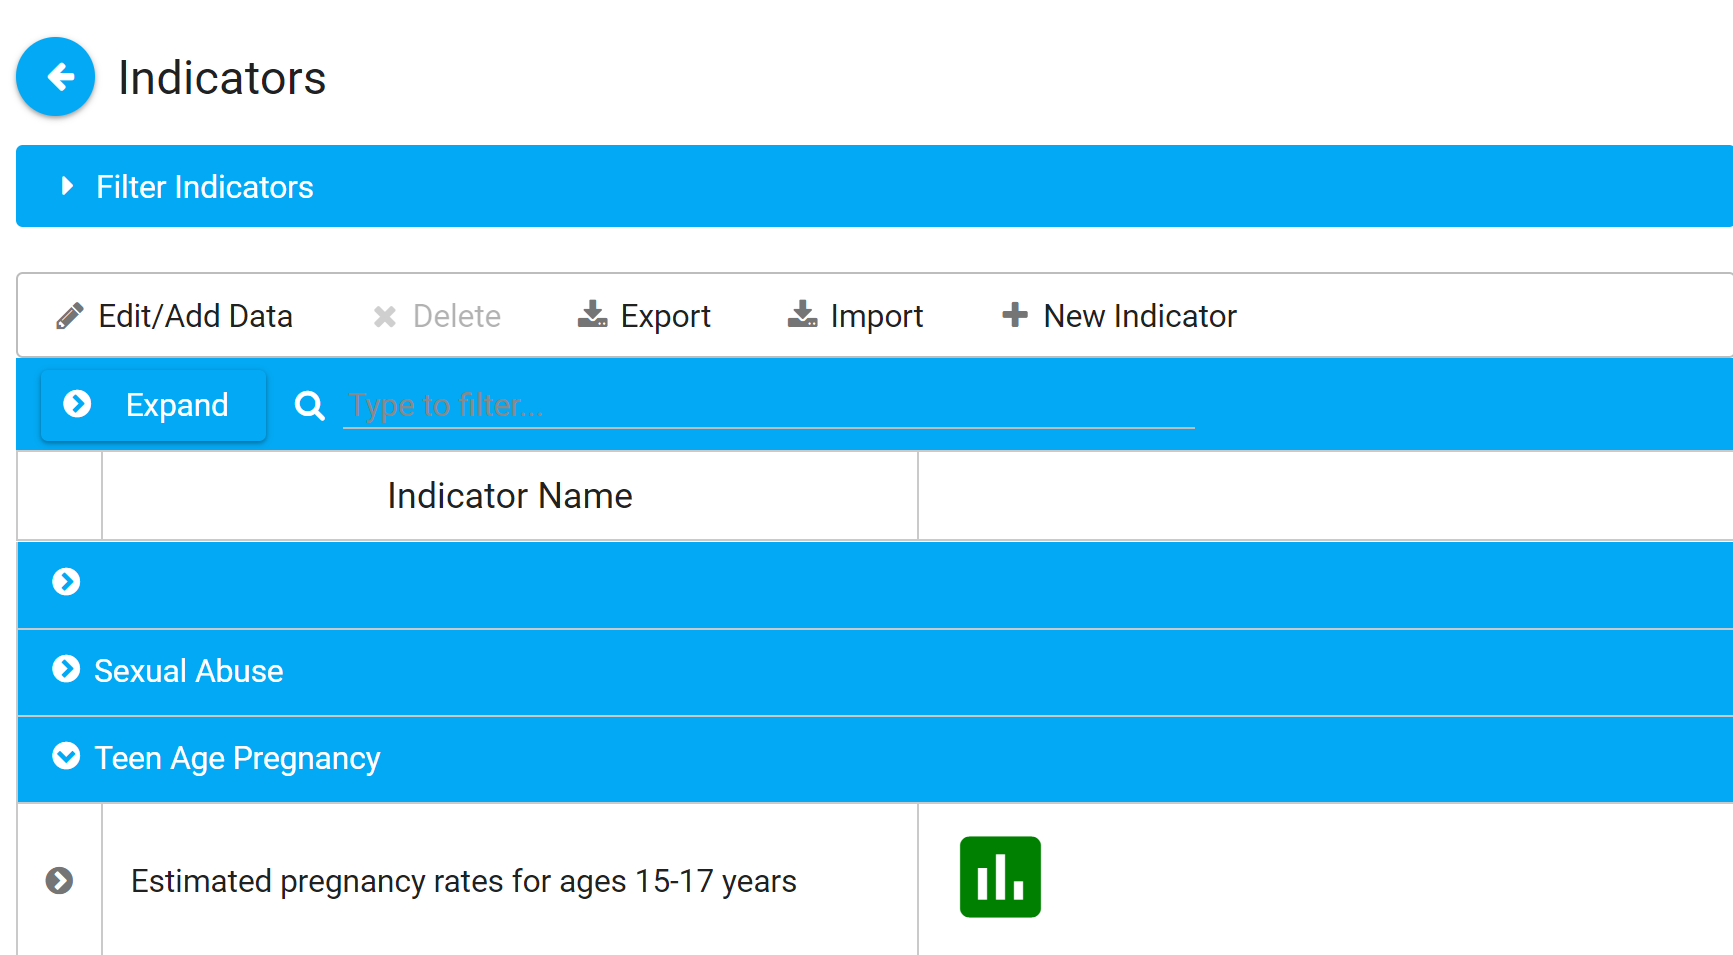
To view Indicators, click on
Indicators
in the left navigation bar. This will take you
to the Indicators listing page.
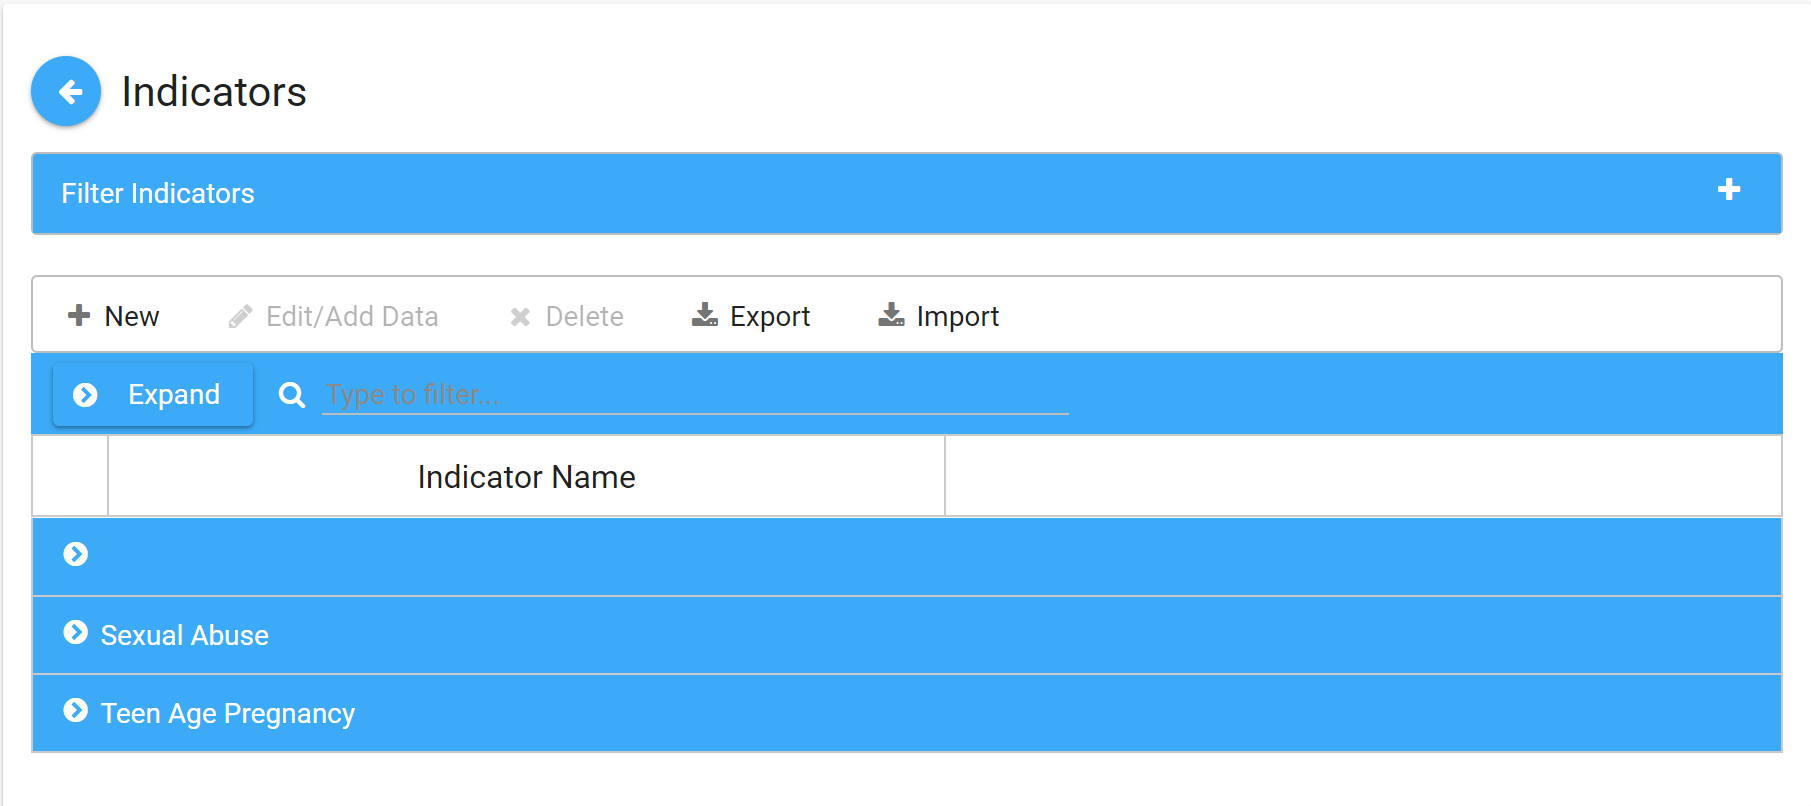
To view the existing indicator data, click on the
> to the left of the indicator you want to view. This will display all existing data for that indicator.
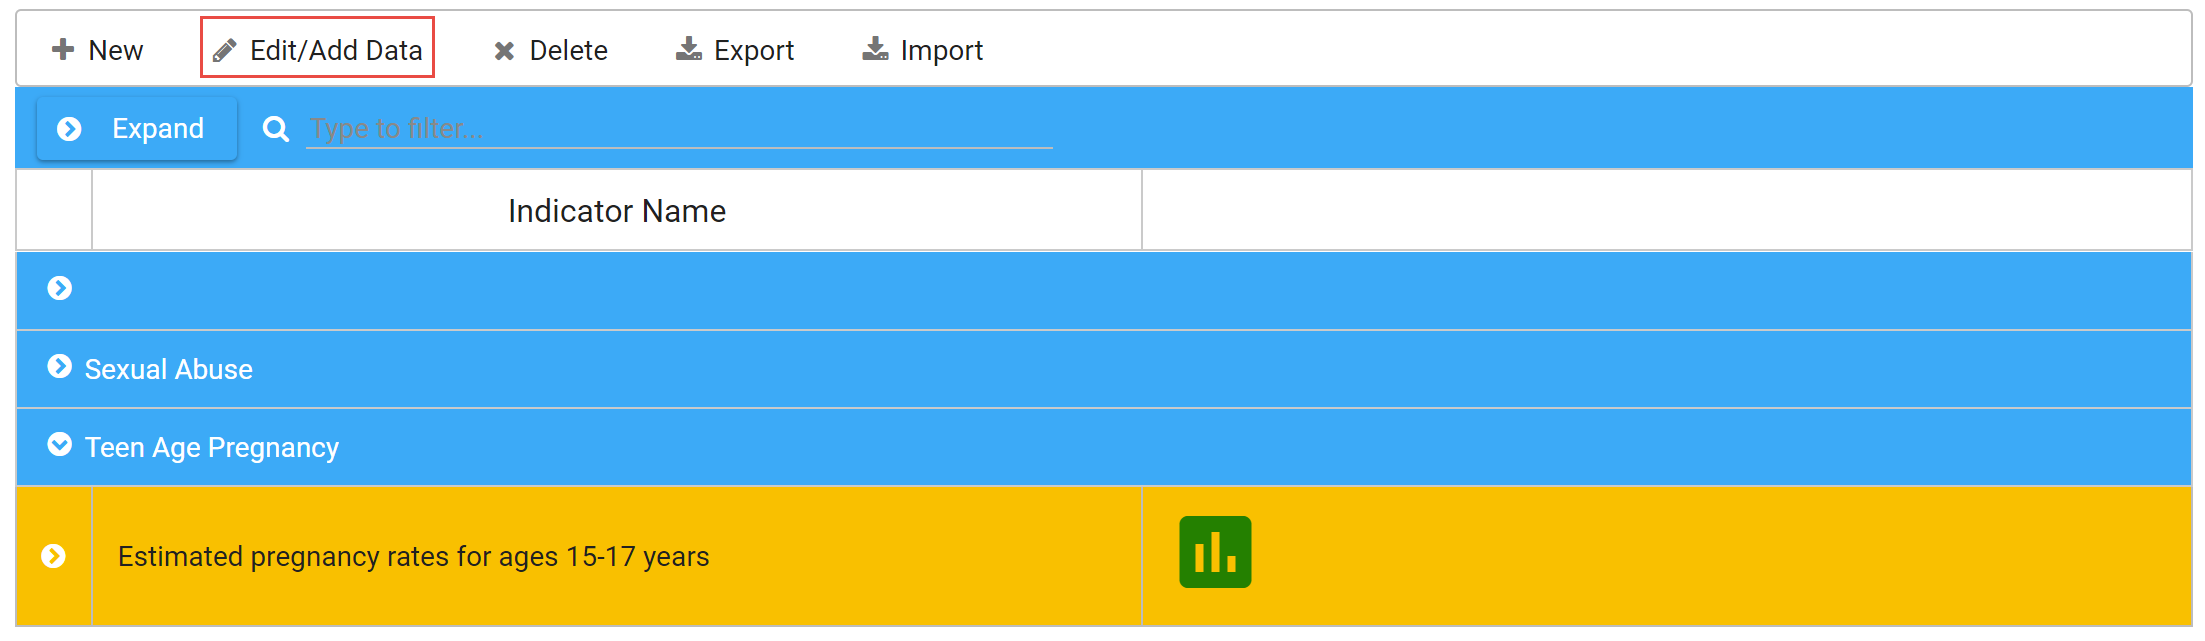
From this page you can add data or make edits to existing indicators, or filter to view just what you want.
- Click on Indicators in the left navigation bar. This will take you to the Indicators listing page.
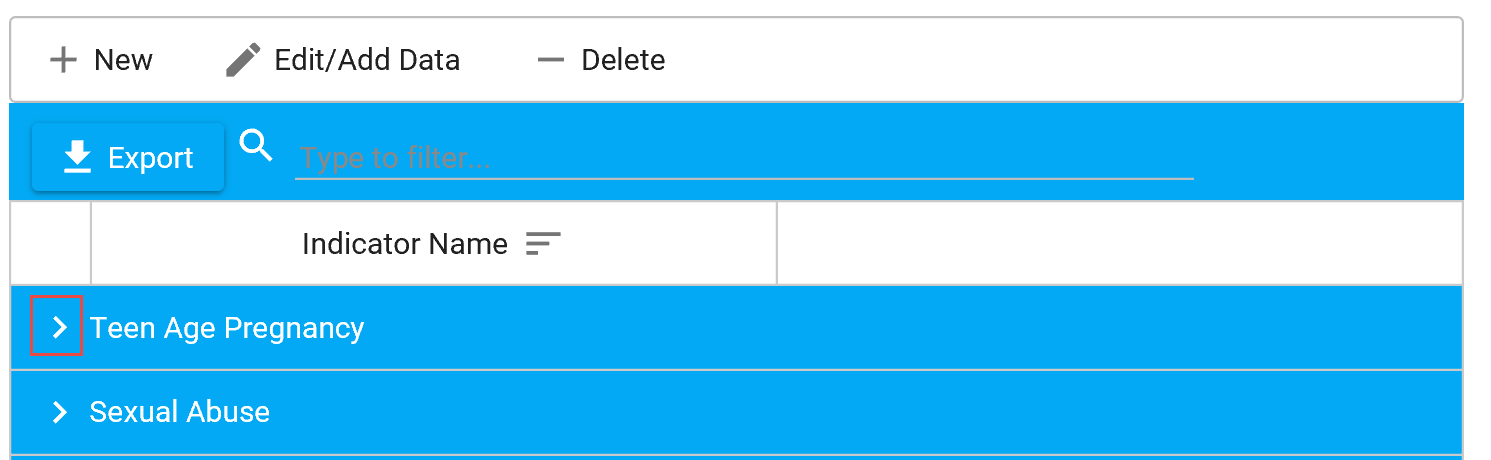
- Click on the > to expand the category (e.g., Teen Age Pregnancy)
-
Click on the category (e.g., Estimated pregnancy rates for ages 15-17 yars)., and then click Edit/Add Data.
-
Click the Add button at the bottom of the page.
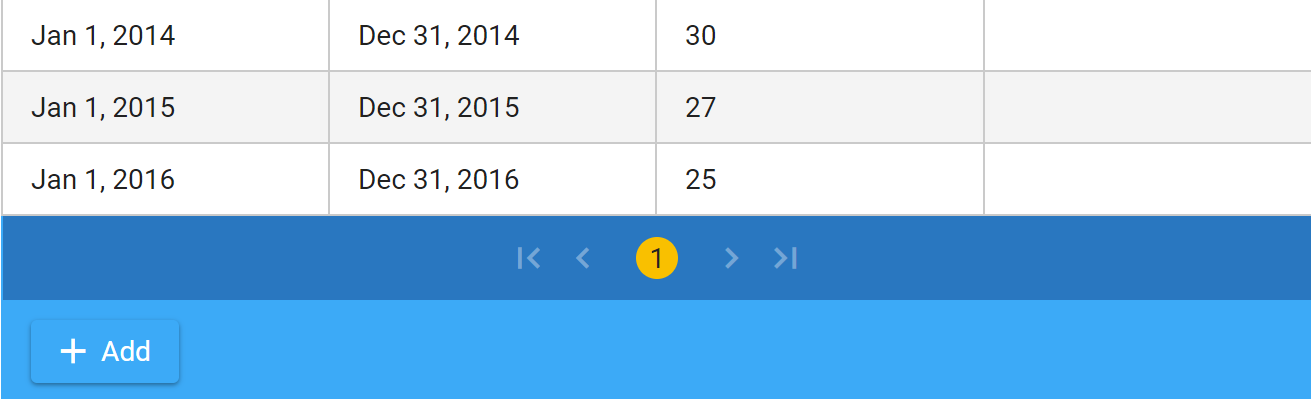
-
Enter the Start Date, Stop Date, Value, and Notes (if needed) for the current time period.
-
Click Save.
-
If you decide not to make any additions or changes to the Indicator, you can click Cancel to leave the Indicator entry without making any changes.
Users will rarely need to edit Indicators. Indicators that have already been created should have all relevant information already filled in. But if you have checked with your project lead and you do need to change or update any Indicator information, please follow these instructions.
- Click on Indicators in the left navigation bar. This will take you to the Indicators listing page.
- Scroll to the category you want to update, e.g., Teen Age Pregnancy.
-
Click on the > to expand the category (e.g., Estimated pregnancy rates for ages 15-17 yars).
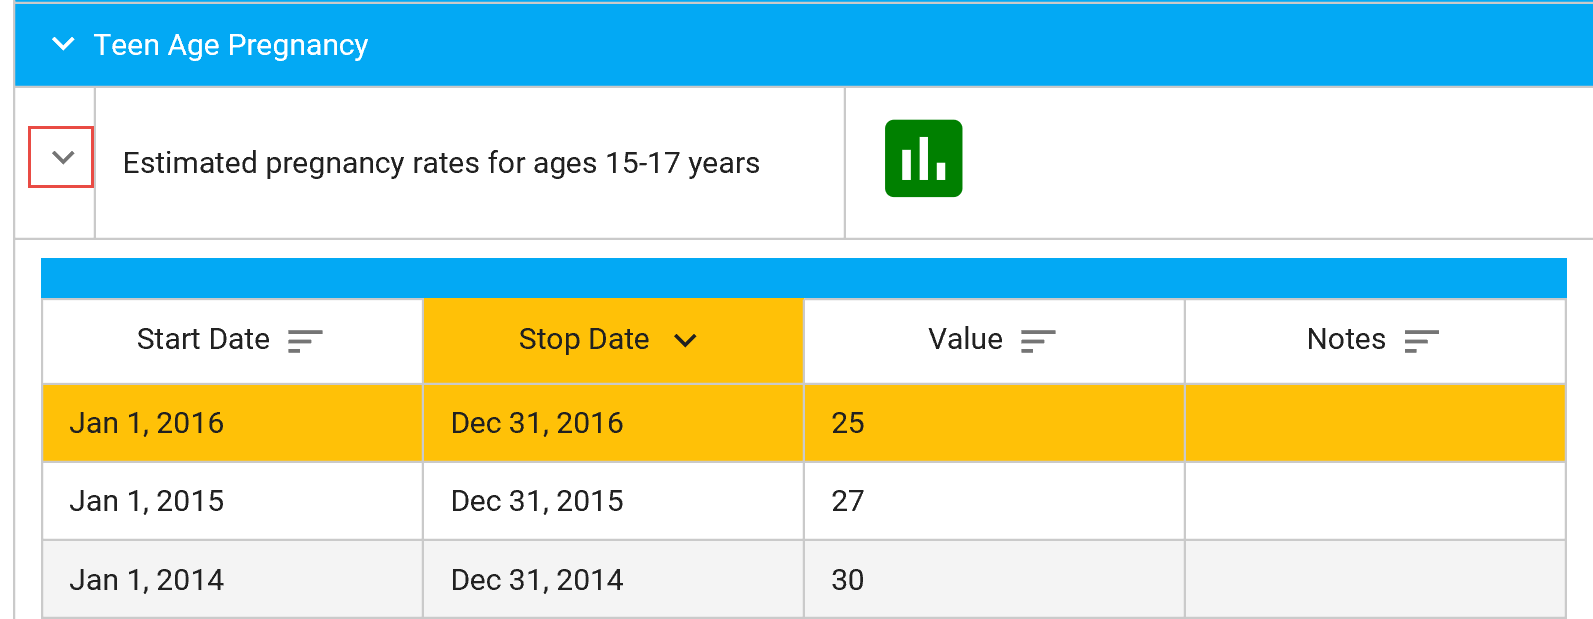
-
Click on an existing entry to edit.
- Make the edit and click
Save.
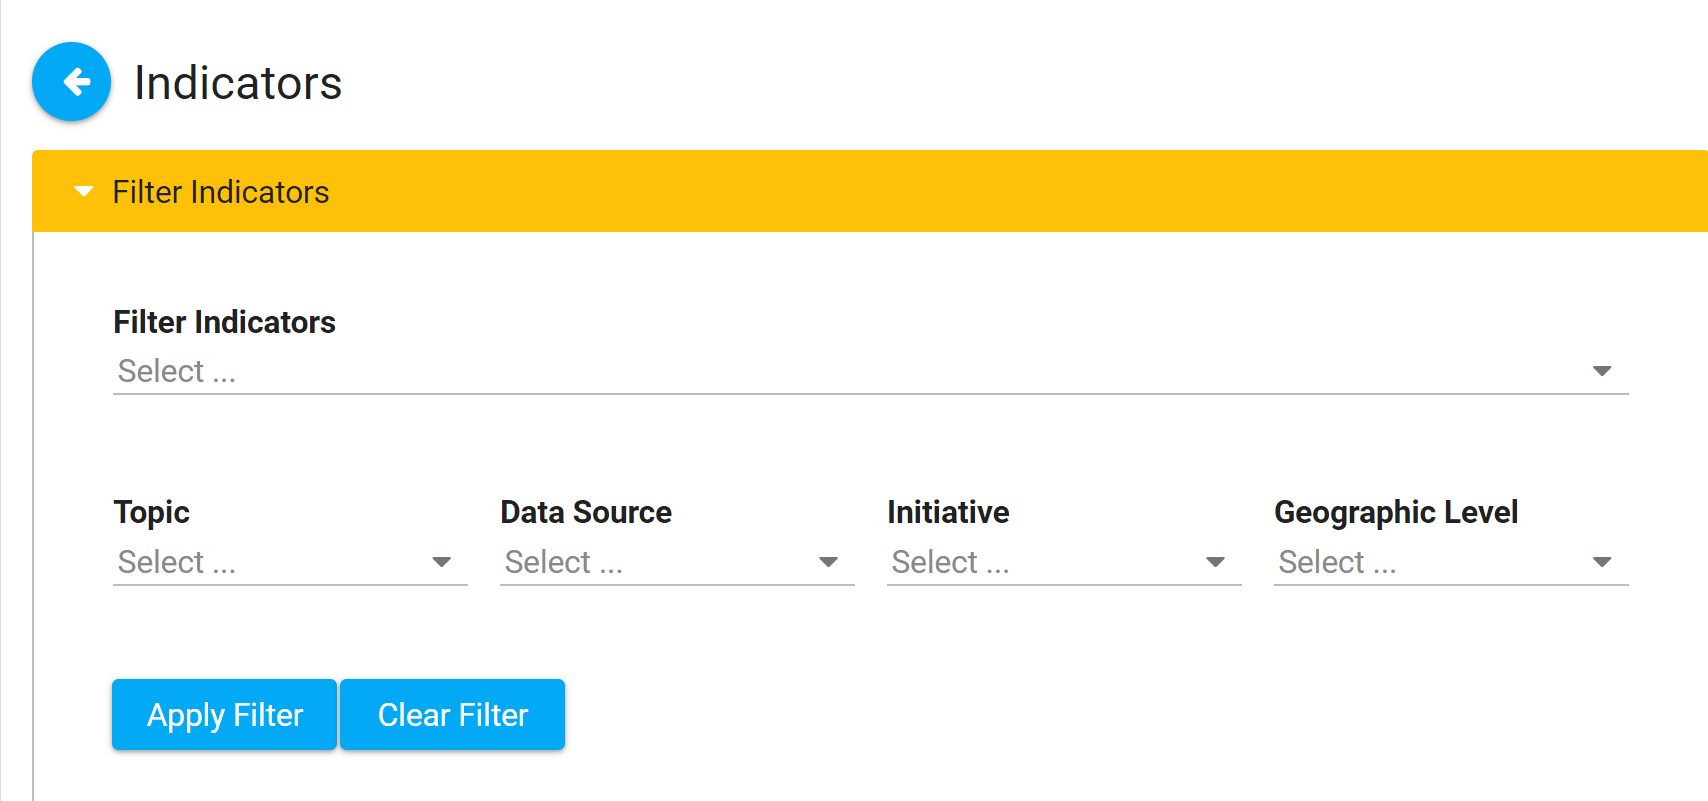
Filter Indicator View
You can select from the follow filters to choose what data you view.
-
Go to Dashboard and Click
Graphs button.
-
Click on + New Graph at the top of the Graphs page
- Select the appropriate option from the Create new graph dropdown menus
-
Select
Indicators from the What data type do you want to graph? dropdown menu.
-
Select options from the additional fields that display.
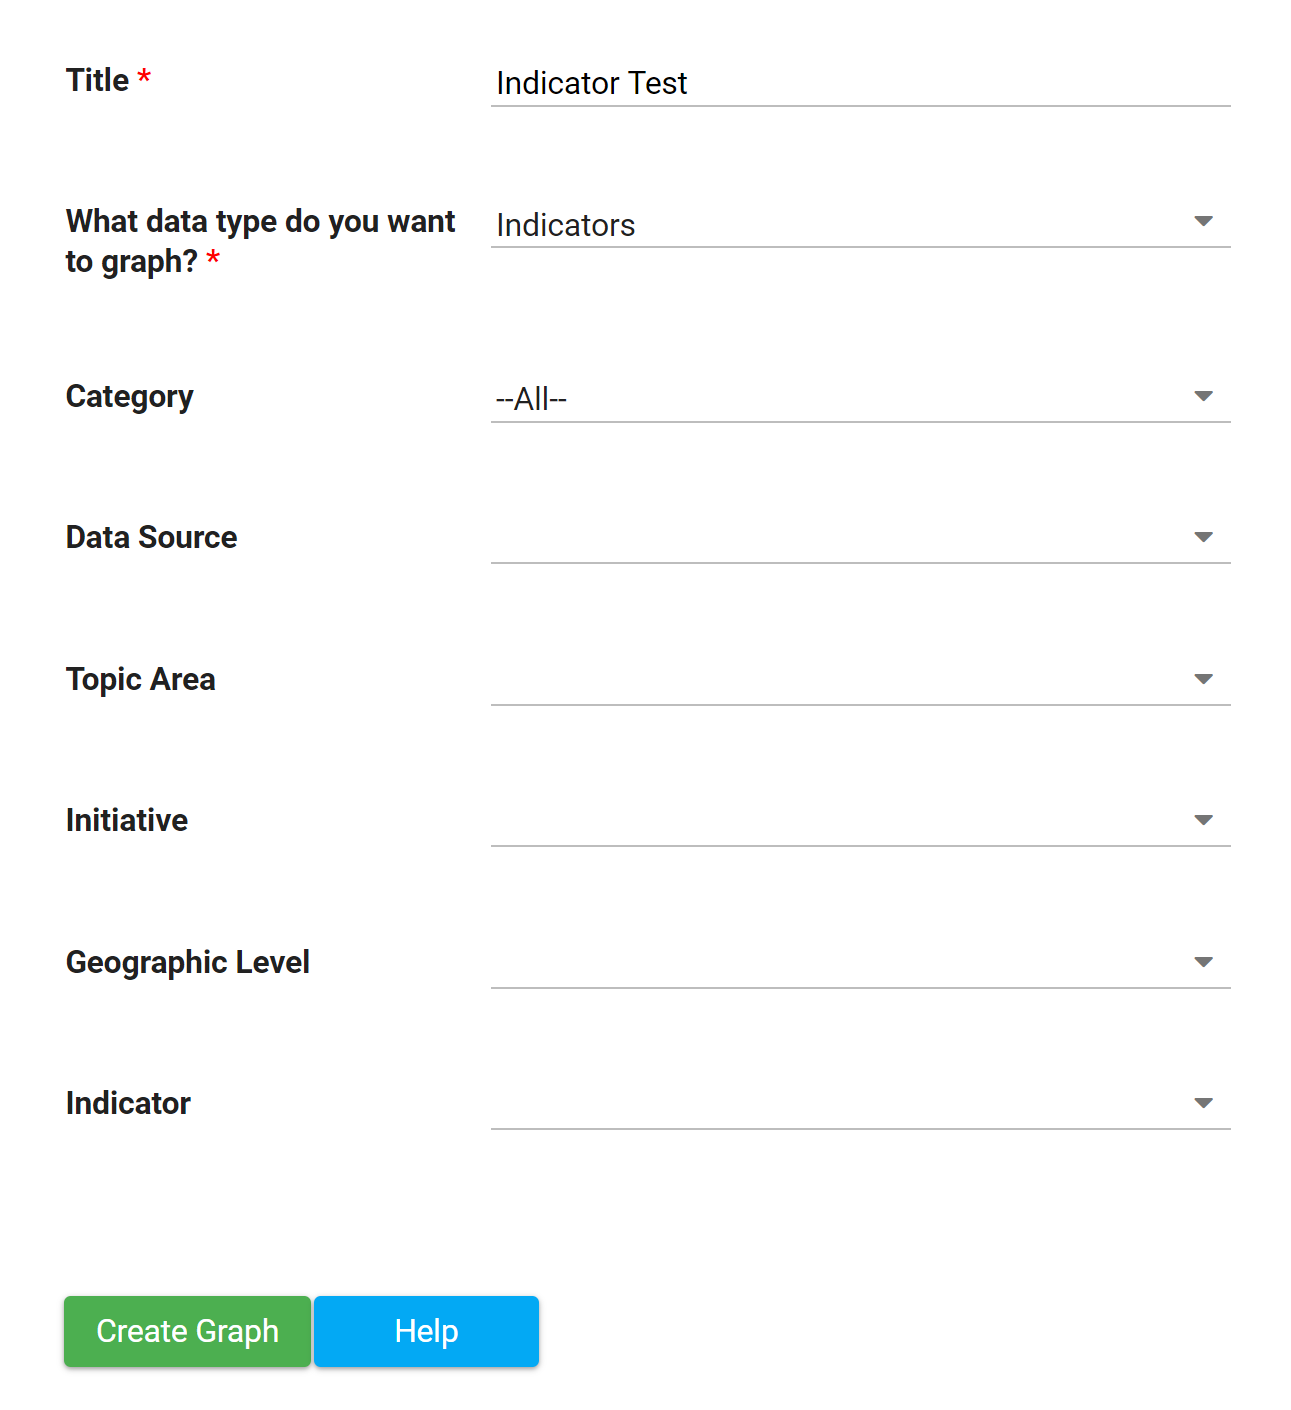
- Click Create Graph..
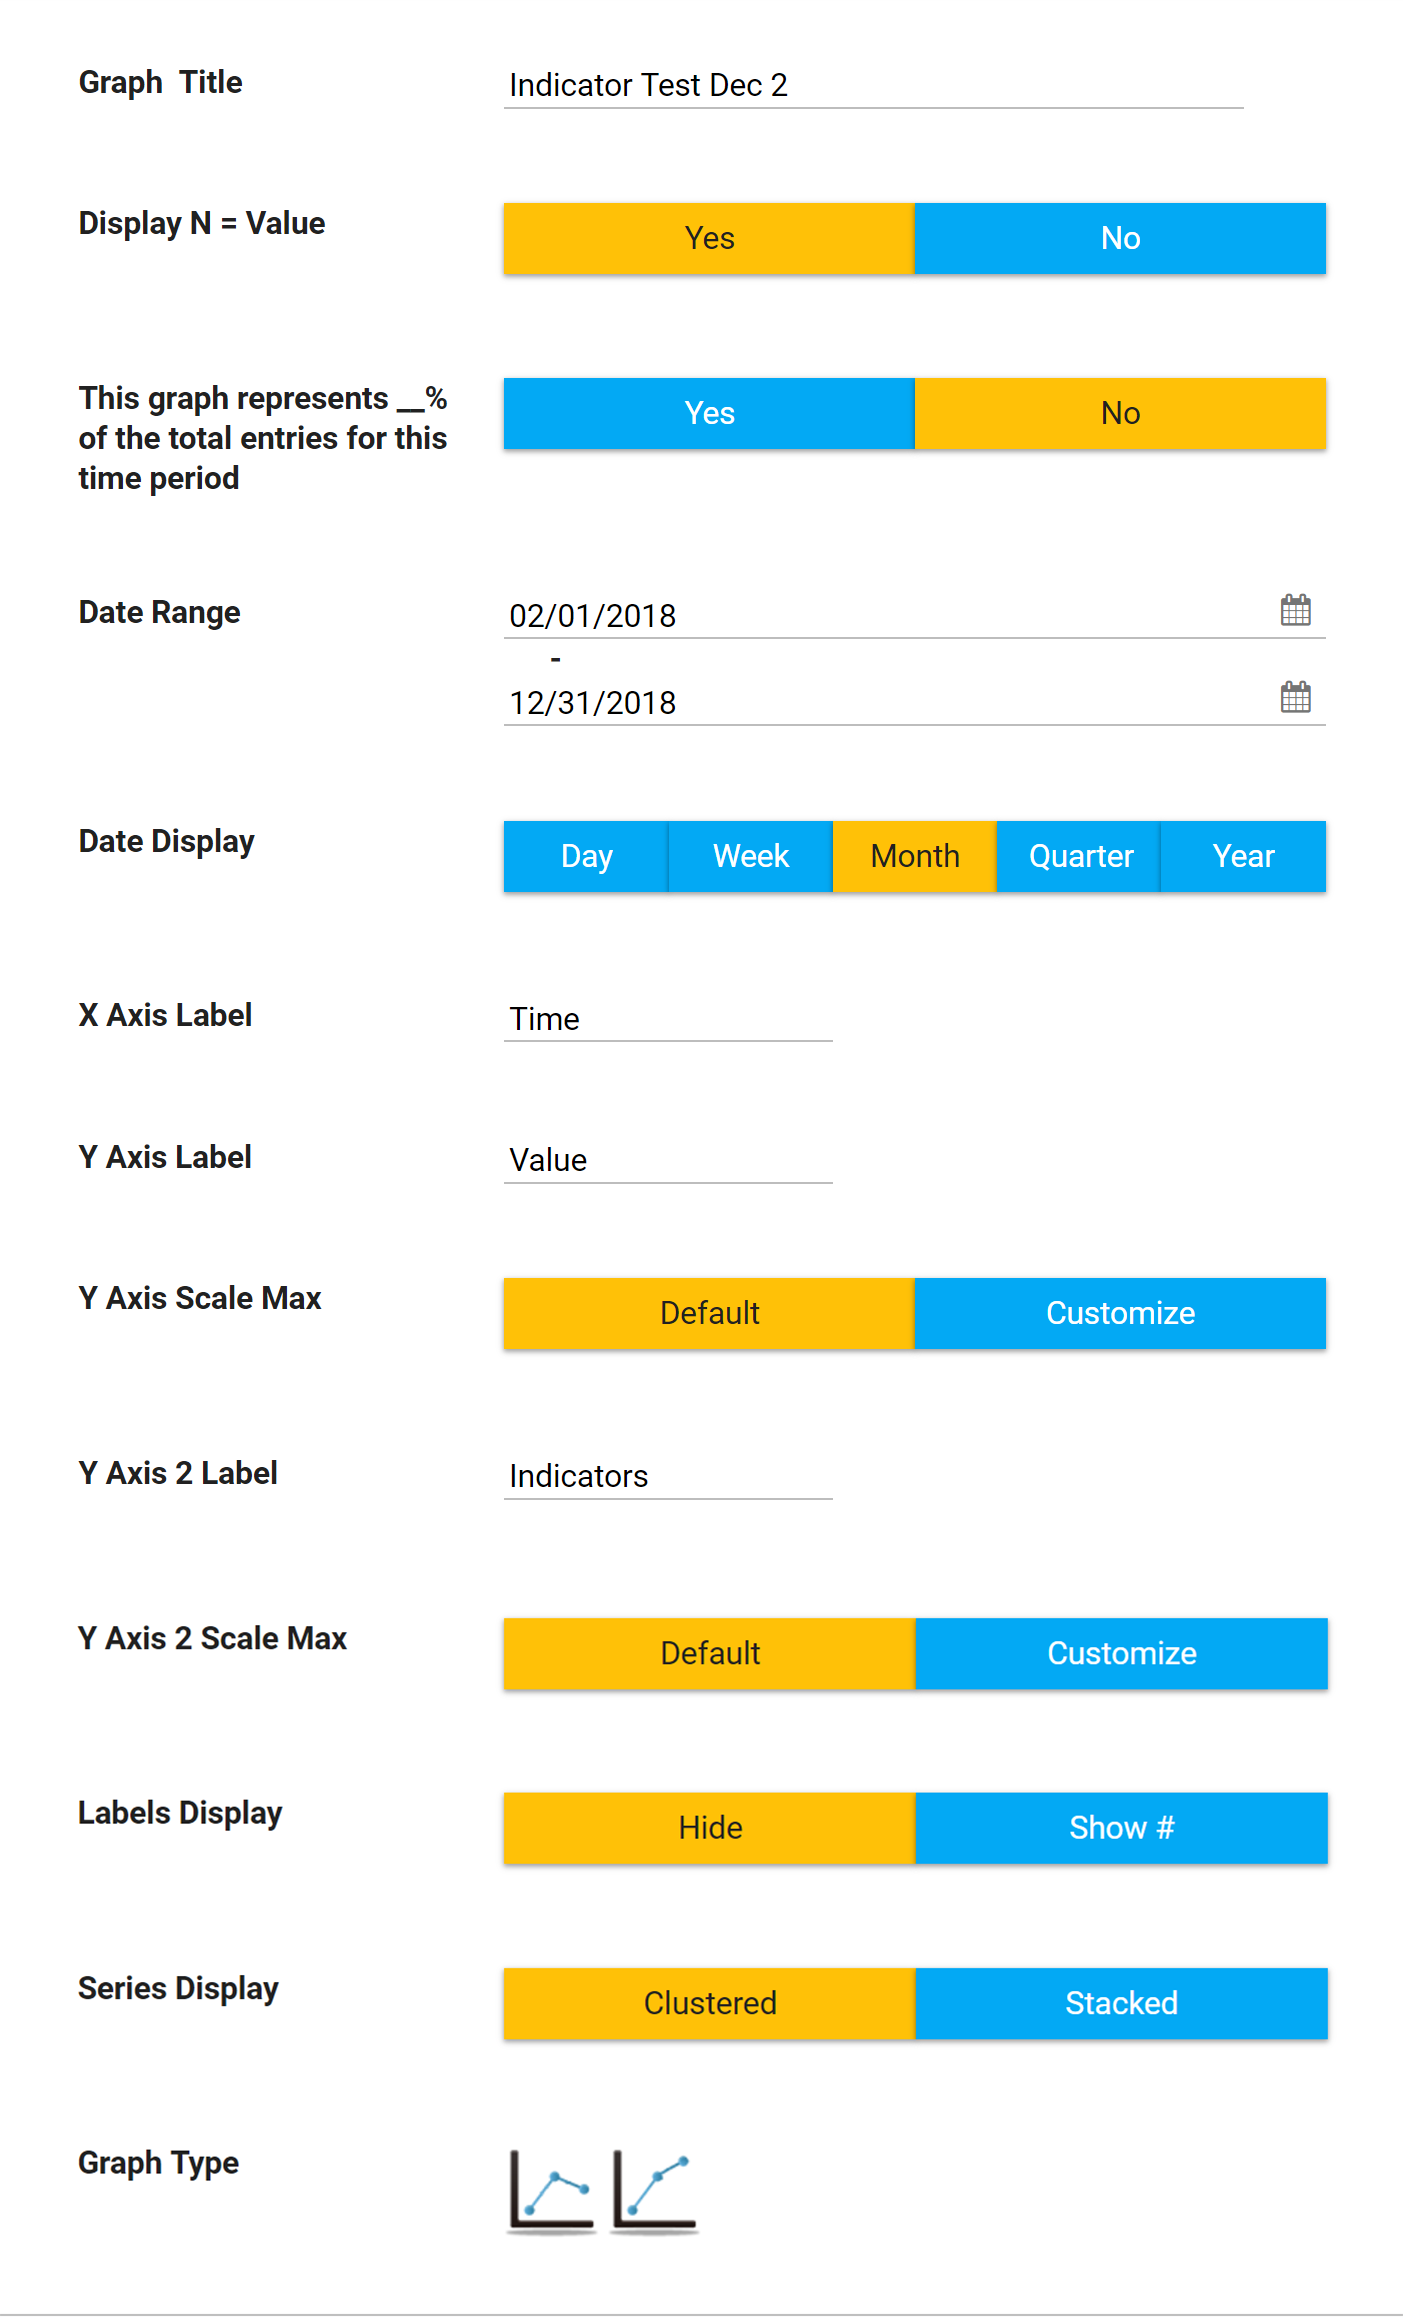
- Enter Date Range and change other options as needed.
- When you are done making changes on this page click:
- Update Graph if you want to save and stay on this page.
-
Save & Go to Graph if you want to save and go back to the graph.
-
Return to Graph if you do not want to save changes.
- Click on
Indicators on the left navigation bar.
-
If you want to export all Indicators, click
Export.
-
If you want to export specific entries.
- Click Filter Indicators and select the filters you want,
- Click Apply Filter.
- Click Export.
- Note: You must create or add any needed Indicator Form dropdown choices first in the Administration section of your CCB.
- Either
export existing indicator data to use as a blank template for the column headers, or
create your own Excel doc with the following headers:
Category
|
Data Source |
Indicator Name |
Description |
Topic Area |
Initiative |
Geographic Level |
County |
Start Date |
Stop Date |
Value |
Notes |
Testing
| Behavioral Risk Factor Surveillance System
| Paul TEST | TEST | Mental Health | Roadmap | County | Douglas | 1/1/2014 | 12/31/2014 | 29.00 | Youth |
Testing
| Behavioral Risk Factor Surveillance System | Paul TEST | TEST | Access to healthy nutrition | Roadmap | County | Douglas | 1/1/2013 | 12/31/2013 | 31.70 | |
Testing
| Behavioral Risk Factor Surveillance System | Paul TEST | TEST | Access to healthy nutrition | Roadmap | County | Douglas | 1/1/2011 | 12/31/2011 | 31.70 | |
Testing
| Behavioral Risk Factor Surveillance System | Paul TEST | TEST | Access to healthy nutrition | Roadmap | County | Douglas | 1/1/2012 | 12/31/2012 | 31.70 |
|
- Any existing data from an old form (see above) should be deleted and replaced with your own data in the Excel doc.
- The name of your indicator (Indicator Name) should be whatever you wish to call this new Indicator, and it should remain consistent for each entry (see above "Paul TEST"). Most of the other data will be replicated in each entry as well, with the exception of the last four colums:
Start Date,
Stop Date,
Value, and
Notes. Those are different in each row/entry.
- All of the columns above are required for import, with the exception of "Geographic Level." If this colum is filled out, the corresponding/triggered column for either
County,
State,
City, or
Custom Location should be filled in as well (it is a required field).
- Even though these column headers are required for import, it is not necessary to include data in the "Notes" field. Make sure the header is there, however.
- Additional columns/data may be included if desired, but these above are required.
- Once you have your data with the headers in a saved Excel doc, it is ready for import.
- Click on the Import button in the top section:
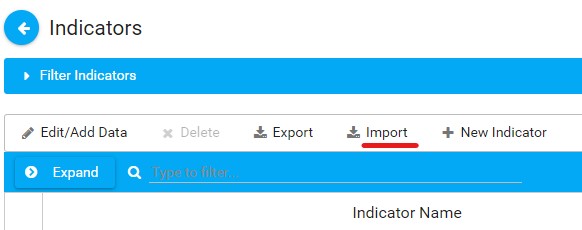
- Choose the Excel file from your computer and upload it.
- After that, you'll see the Form Field Mapping interface, where you will drag and drop the fields on the left into the matching columns on the far right:
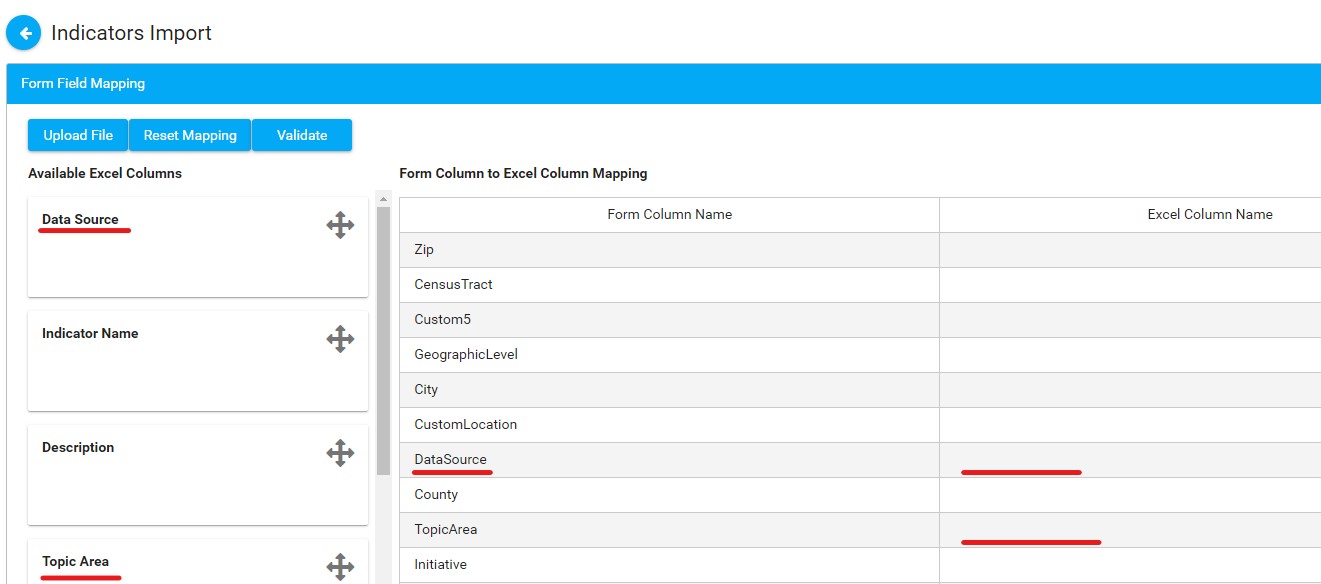
- Once you've finished the mapping, click on
Validate. If there are any errors, correct them. If not, click on
Upload File. You should see an "Import Successful" prompt after that.