Managing Graphs
In order to display graphs populated by your CCB data, you will need to feature the
Graphs web part on the site.
- Go to
Site Settings, and select
Edit Page.
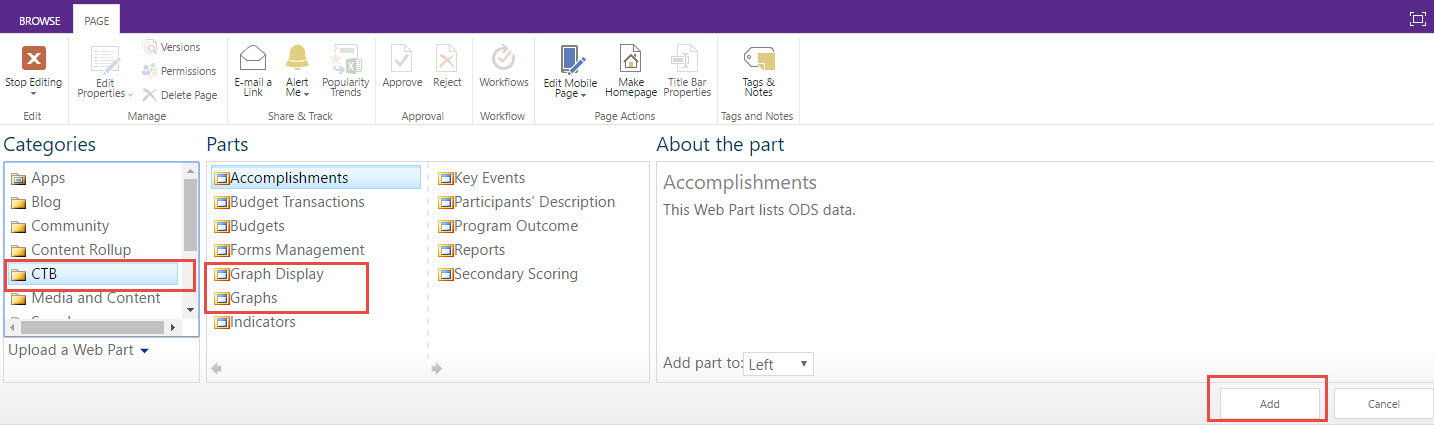
- Click the
Add a Web Part link. This will bring up a box with all of the categories for web parts available to add to the page.
- Select
CTB for the available Community Check Box web parts. They are listed alphabetically.
- Select
Graphs or
Graph Display from the available web parts, and click
Add.

Once the web part is featured on the site, you can begin the administration of the graph settings.
To begin, click on the
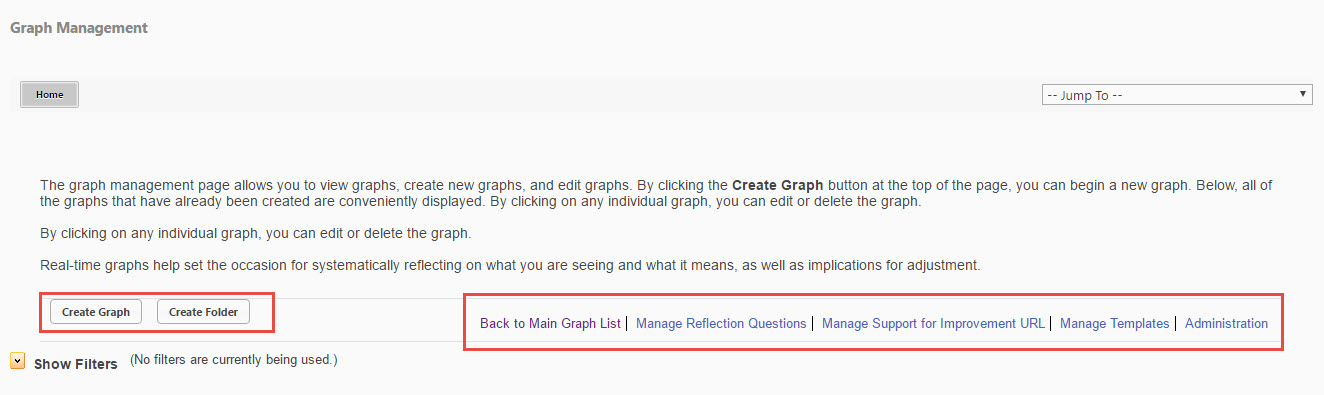
Graphs web part heading to open the Graph Management window.
From this window, you will be able to
Create Graphs,
Create Folders, plus
Manage Reflection Questions,
Manage Support for Improvement URL,
Manage Templates, and perform
Administration.
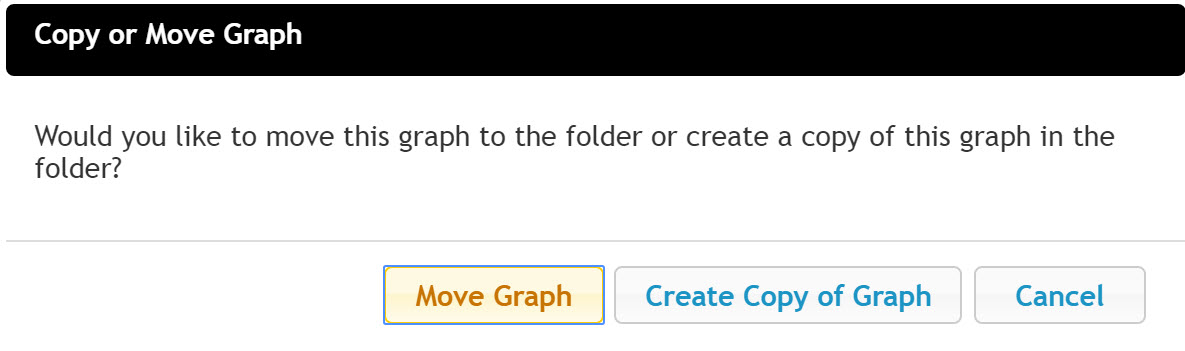
Graphs can be organized into folders by using drag-and-drop. To create a folder: click on "Create Folder" and enter the name for the folder. To move a graph into that folder: click on the name of the graph and hold down the mouse to drag it over the folder where you want it to move. When you let up on the mouse you will see options to move, create a copy or cancel.
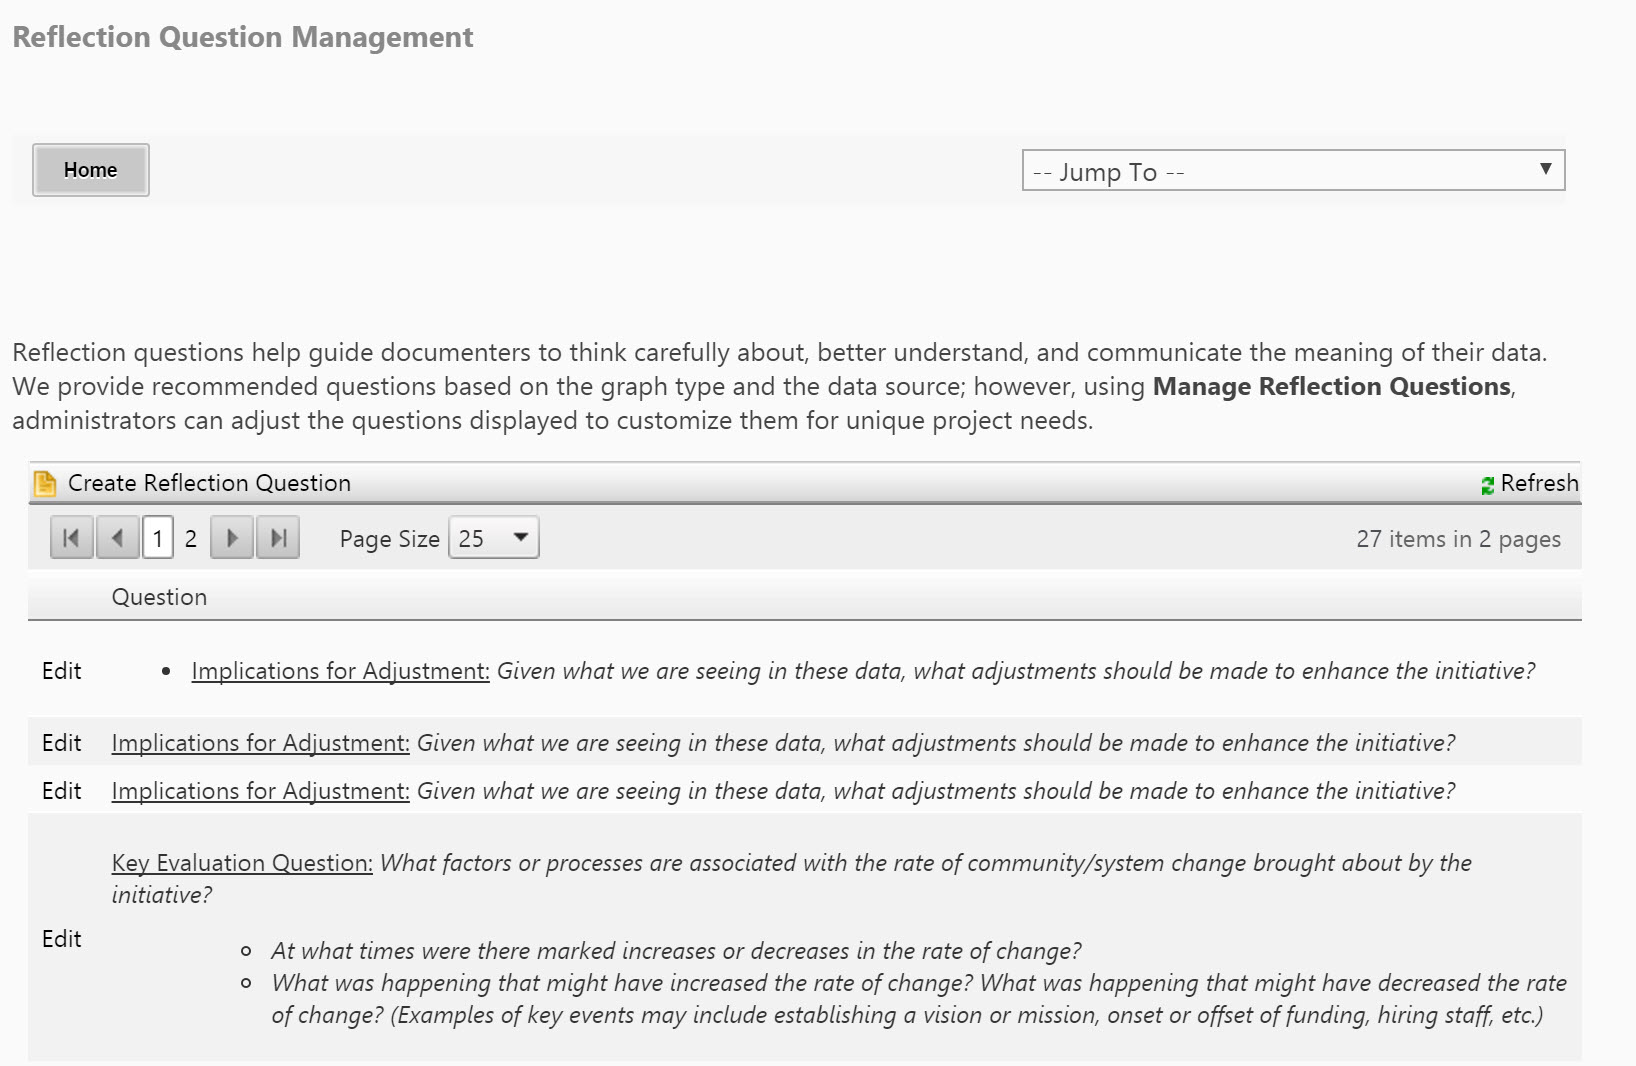
Recommended questions are provided based on the graph type and the data source; however, using
Manage Reflection Questions, administrators can adjust the questions displayed to customize them for unique project needs.

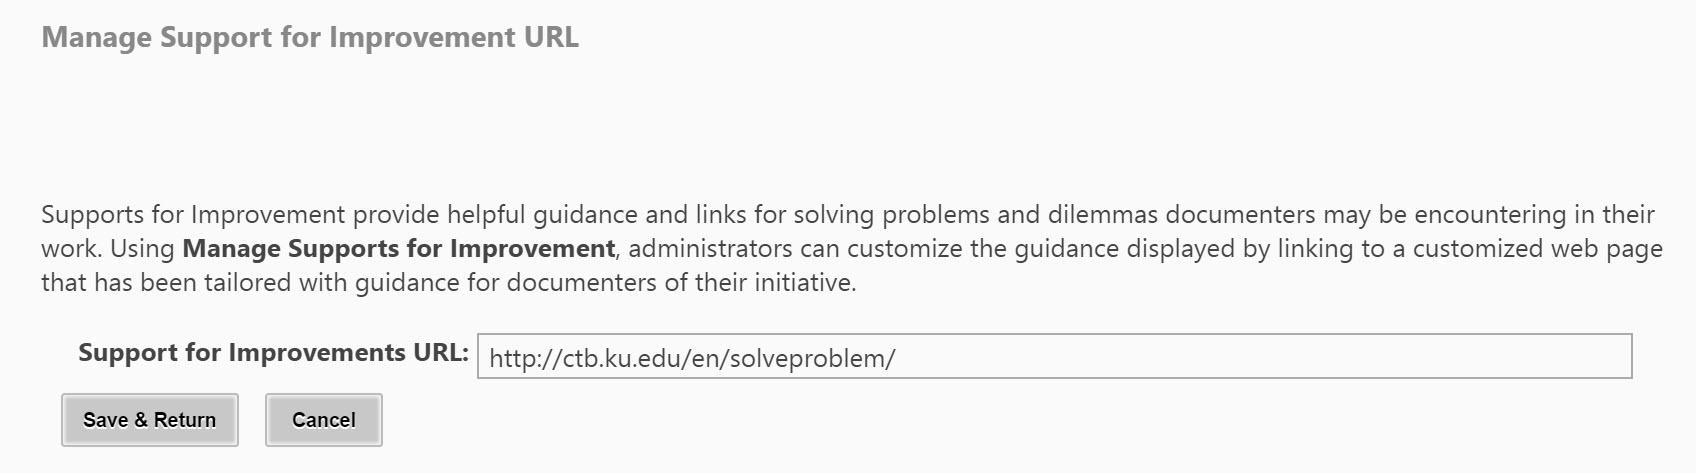
Support for Improvement provides helpful guidance and links for solving problems and dilemmas documenters may be encountering in their work. Using
Manage Supports for Improvement, administrators can customize the guidance displayed by linking to a customized web page that has been tailored with guidance for documenters of their initiative.

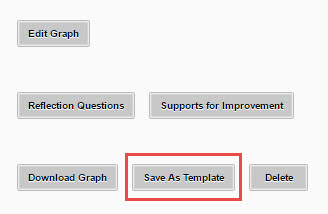
If you find that you (or users on your site) are creating similar graphs, you can create a template for use with future graphs. Selecting Manage Templates will take you to a page where you can view graphs that have already been created, or create a new template by selecting Create Template. This will walk you through the process of creating a graph, which can be saved as a template. You can also select
Save As Template for any existing graph.

Users will be able to choose a graph template when they select Create Graph from the main graphs page, then Create graph from template.
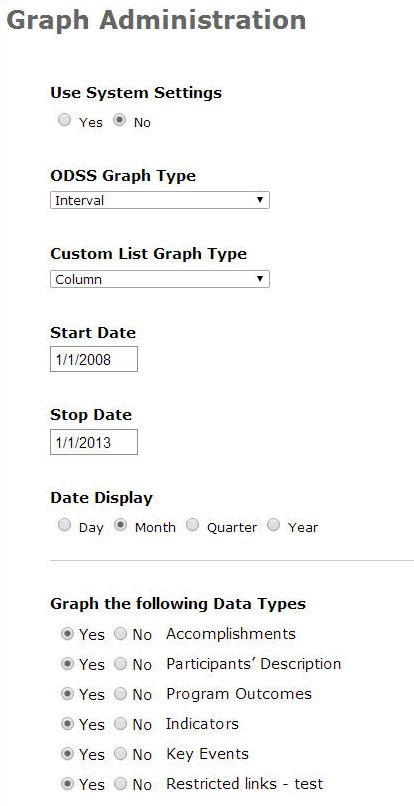
Here, you can designate default settings that will determine how graphs are displayed when users first create a graph (without further customization). You may keep the default system settings or you may customize settings unique to graphs created for your initiative.
Use System Settings allows site administrators to use preset system settings for the graphs. Once users have created a graph, even if they have used the pre-set system settings, they can always customize by selecting
Edit Graph.
If you select
No under Use
System Settings, you will be able to define the default settings for various graph types. Customizations may include changing the default start and stop date and how the data is displayed.
Accomplishment Graph Types will be set for the individual questions used within the CCB Form.
-
Interval Graph: Interval (also called line) graphs are used to track changes over periods of time or cumulative changes.
-
Pie Chart: Pie charts are best to use when you are trying to compare parts of a whole or show a distribution of proportions. Often, users find it helpful to view Accomplishments by characteristics such as Goal, Duration, Sector, and Strategy as pie charts.
-
Column Graph: Column (also called bar) graphs are used to compare things between different groups or to track changes over time. However, when trying to measure change over time, column graphs are best when the changes are larger.

Once graphs have been created, site administrators have the ability to display these graphs on their WorkStation/CCB. This is an especially valuable tool for highlighting the work of community and research partners.
- Go to Site Settings, and select Edit Page.
- Click the Add a Web Part link. This will bring up a box with all of the categories for web parts available to add to the page.
- Select CTB for the available Community Check Box web parts. They are listed alphabetically.
- Select Graph Display from the available web parts, and click Add.
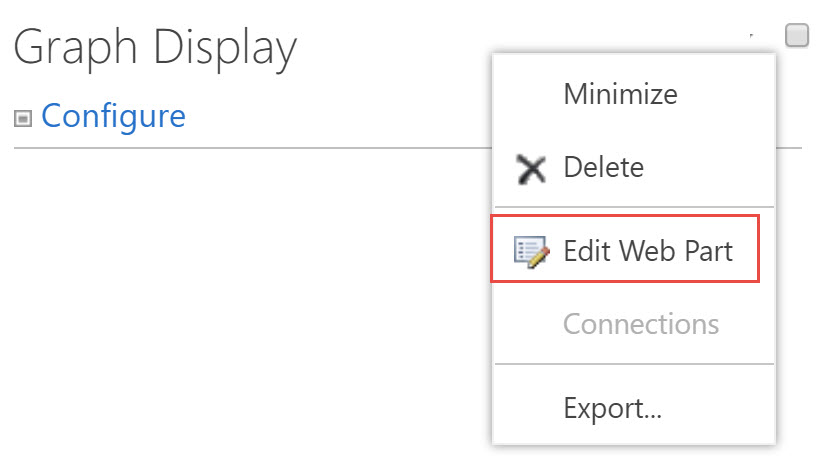
- Click on the small down arrow on the right side of the webpart and select Edit Web Part.
- Change Chrome Type from Default to None.
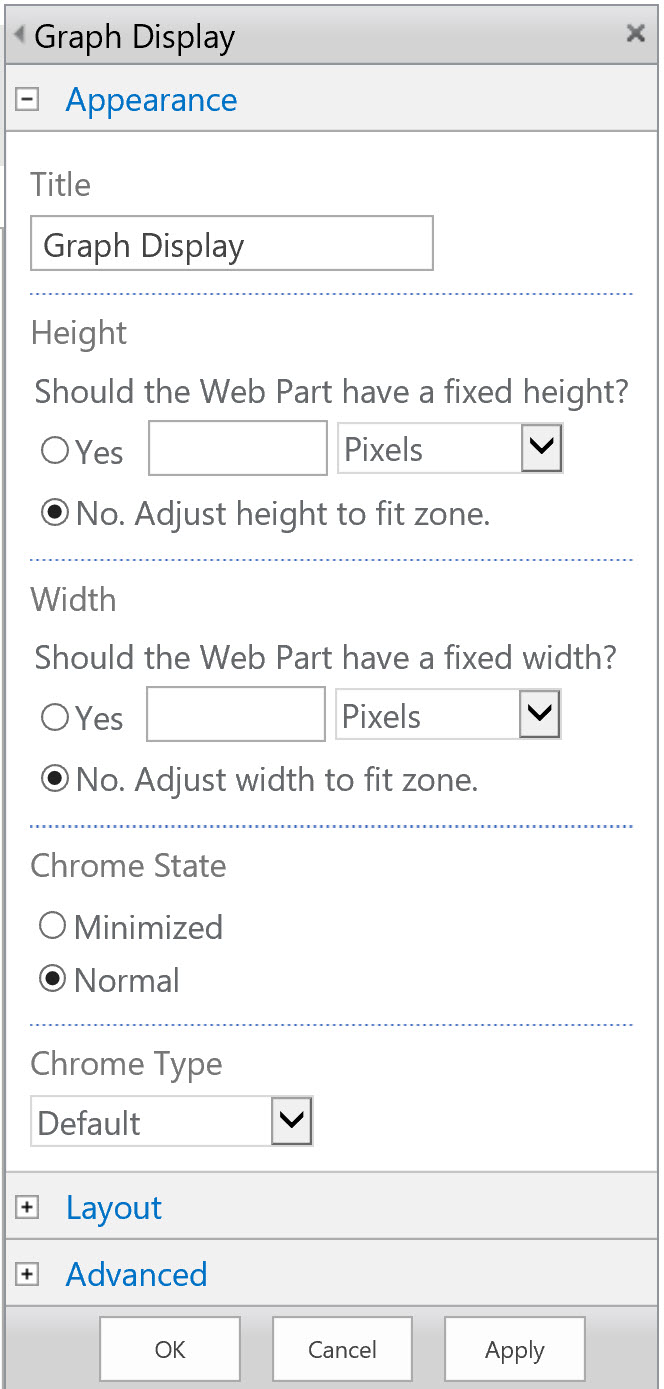
- Click OK.
- Click on Save or Publish to save the page.
- Click on Configure to select the particular graph you want to display.
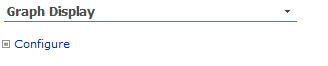
Select the graph to display from the drop-down menu.
Once selected, click Display Graph.