Indicators
Indicators are objective, population-level measures that can be useful in understanding community trends and assessing the impact of collective community action on longer-term outcomes. Indicators provide broad markers to help assess the impact of your work on longer-term outcomes in your community.
Illustrative examples of Indicators:
- Perceived availability of alcohol by youth
- Employment rates
- Infant mortality rates
- Voter turnout
- Number of low birth-rate babies
- Amount of youth participation
- Violent crime levels
Indicators can be graphed on their own to determine changes in the measure over time, or they can be graphed together with Accomplishments to determine if there is a correlation between the level of Accomplishments and changes in the Indicator. Information from the Indicator database can also be exported into Microsoft Excel for further analysis.
Indicator Overview
Each Indicator includes several fields for specific information about the Indicator. These fields include:
-
Indicator: The specific Indicator of interest (e.g., percent of Kansas 10th graders reporting "yes" to 30-day use of alcohol in 2010).
-
Data Source: The source of the data that you are entering (e.g., Dept. of Health and Human Services, U.S. Census, Behavioral Risk Factor Surveillance System, etc.).
-
Initiative: The specific initiative to which the Indicator is related.
-
Topic Area: The category that the Indicator relates to (for example, Health Behaviors, Substance Abuse Prevention, Preventive Care, etc.).
-
Indicator Description: This provides more detailed information about the Indicator and what it represents.
-
Share: Checking this box makes this Indicator data available to all users of the Online Documentation and Support System, including users outside of your project. If you do not check this box, users within your project will still be able to view this data.
-
Geographic Level: This box allows you to select at what geographic level the Indicator is taking place – City, State, a specific Zip Code, County, or Census Tract. You can also choose to enter a specific address. Your project also has the option to add a custom geographic level, if the Indicator is not taking place in one of the specified options.
These fields will always be included in the Indicator, and individual projects also have the option of adding five additional fields that are customized to the information they would like to collect.
View Indicators
Your site owner should have already set up Indicators for you. If you don't see any Indicators or need to add a new one, please check with your site owner.
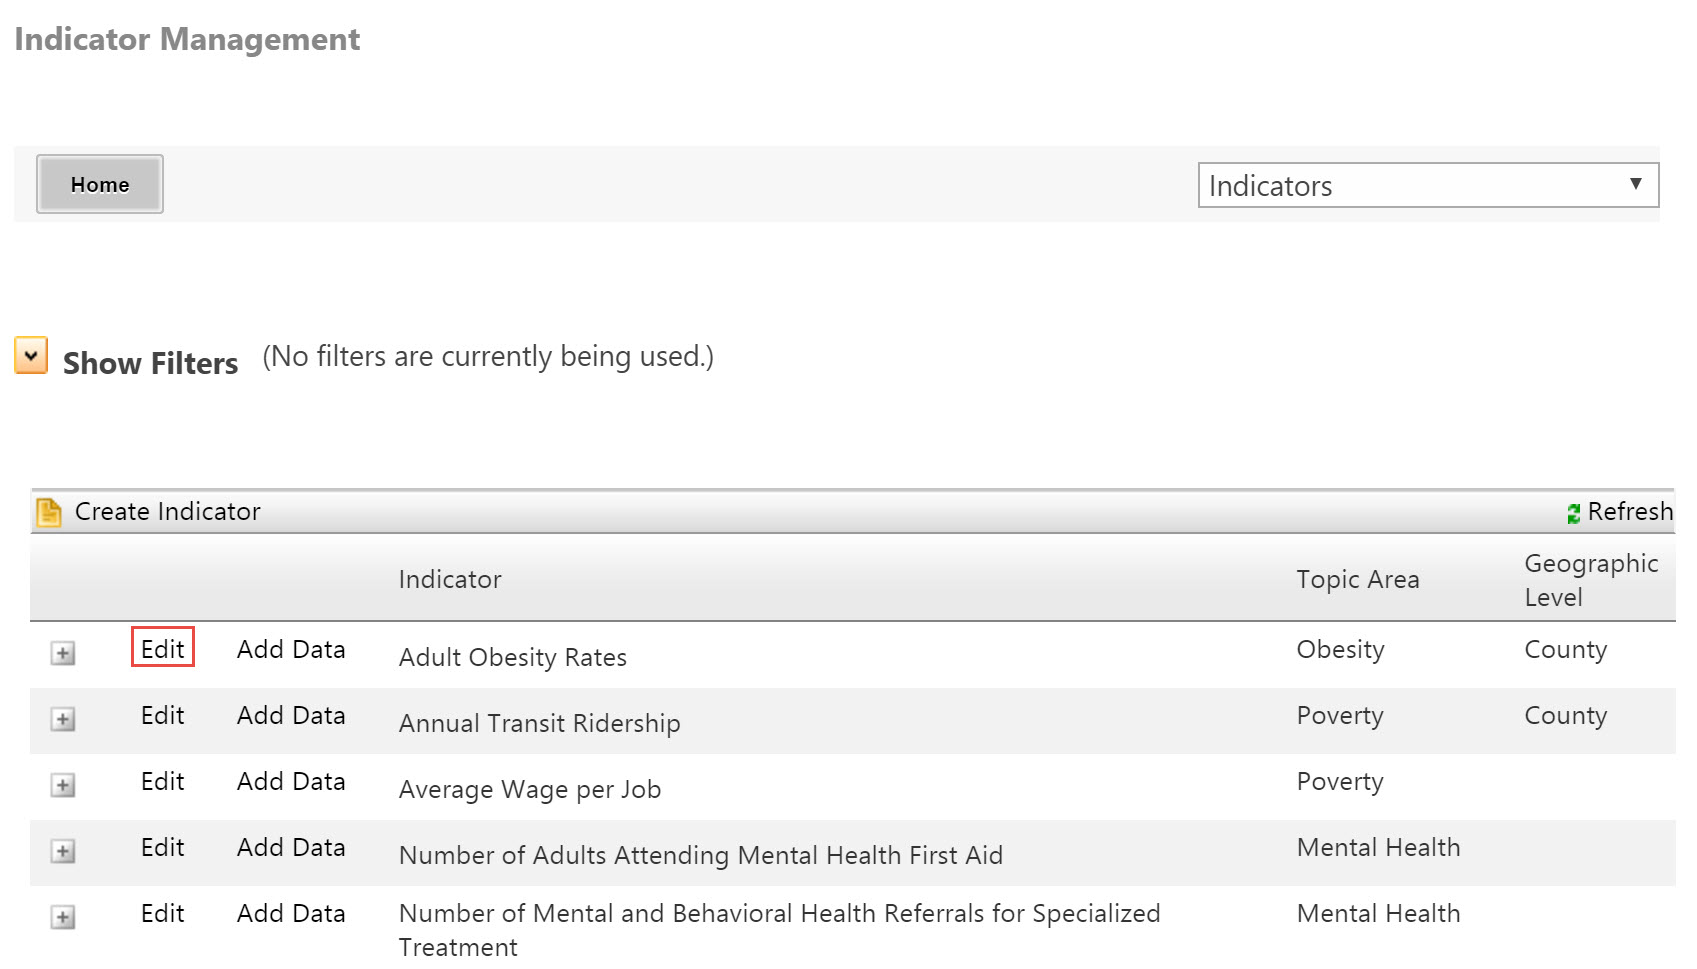
To view Indicators, click on the heading for the Indicator webpart on your site or, if your site uses buttons instead of the Indicator webpart, click the "View Indicators" button. This will take you to the
Indicator Management page.
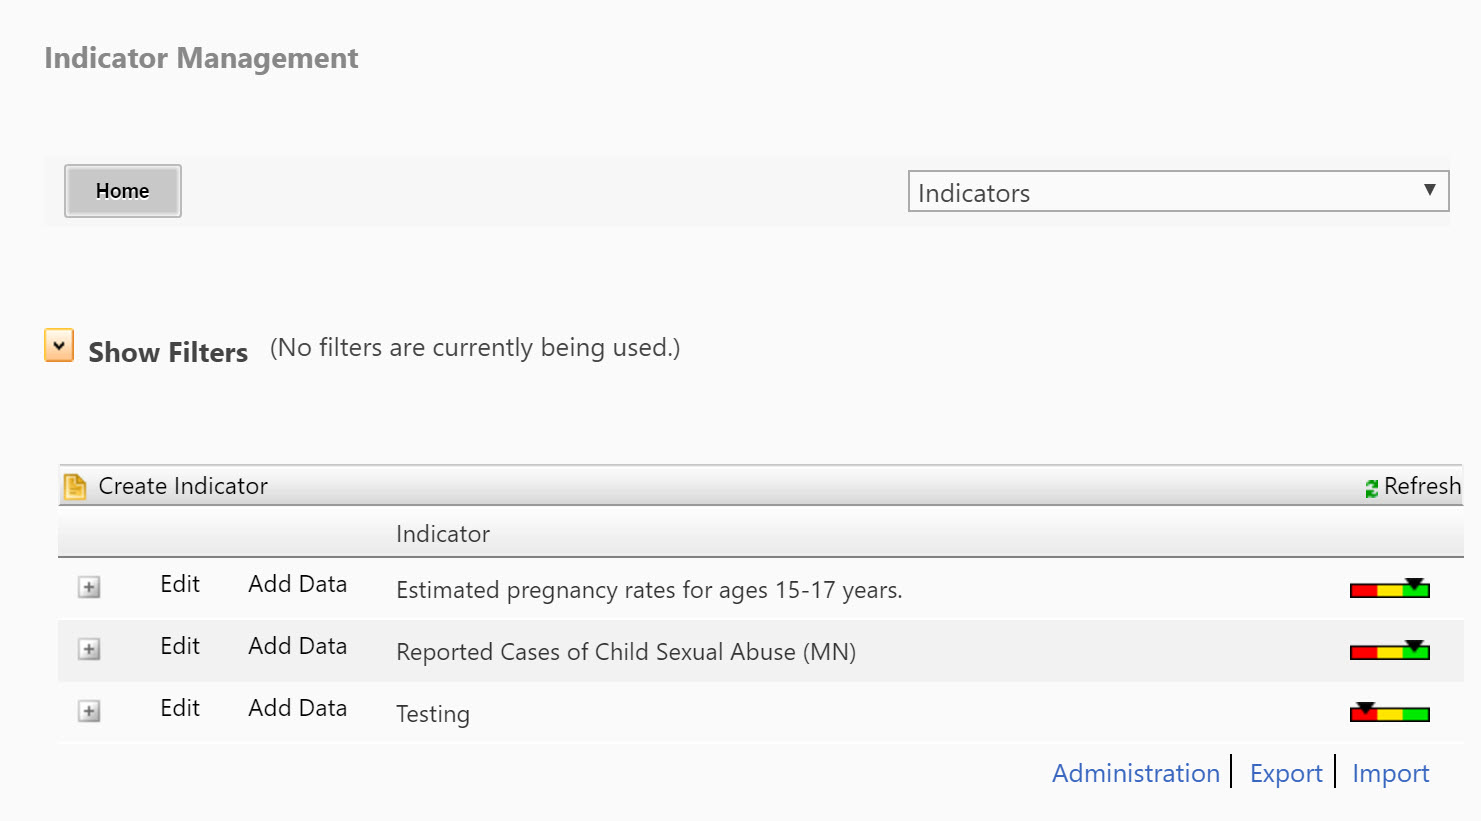
You can also filter the results on the Indicator Management page by clicking on
Show Filters and selecting the filters you want.
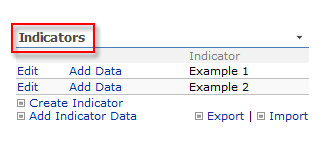
Add Indicator Data
Click the
Add Indicator Data link at the bottom left of the webpart. If your site uses buttons, click on the
Add Indicator button.
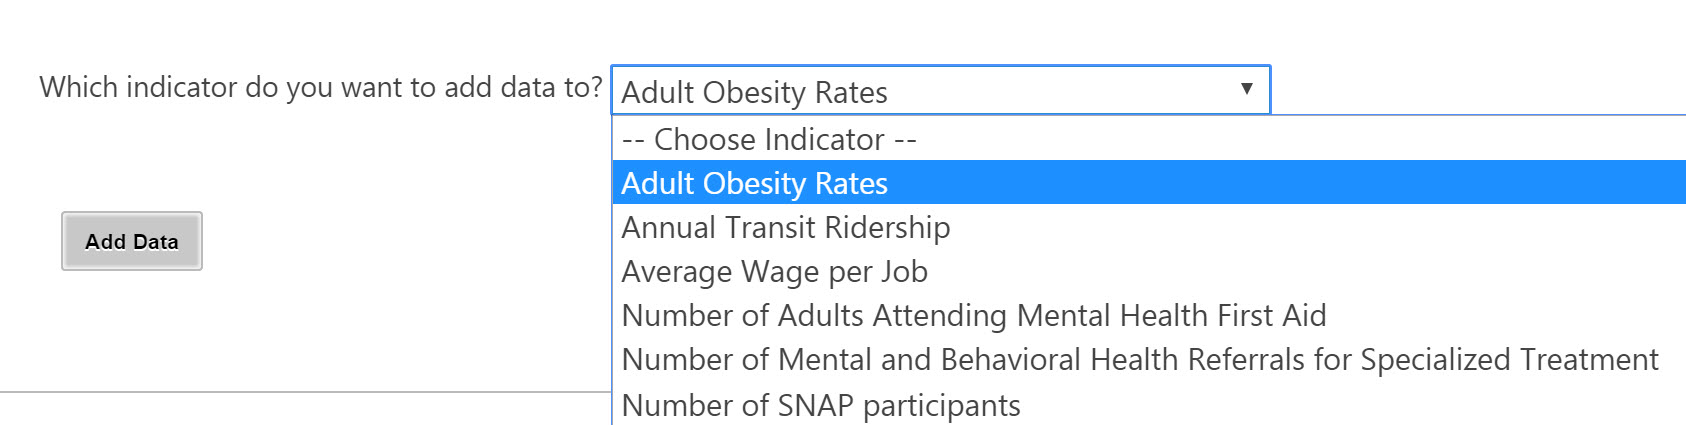
This will direct you to the Indicator Data Entry page or, if you have multiple indicators, to a page where you can select the Indicator to which you want to add data. Once you have located the Indicator for which you are entering data, you can select it from the drop-down list and click the
Add Data button, or click the
Add Data link next to the Indicator from the webpart or the listing page:
| |
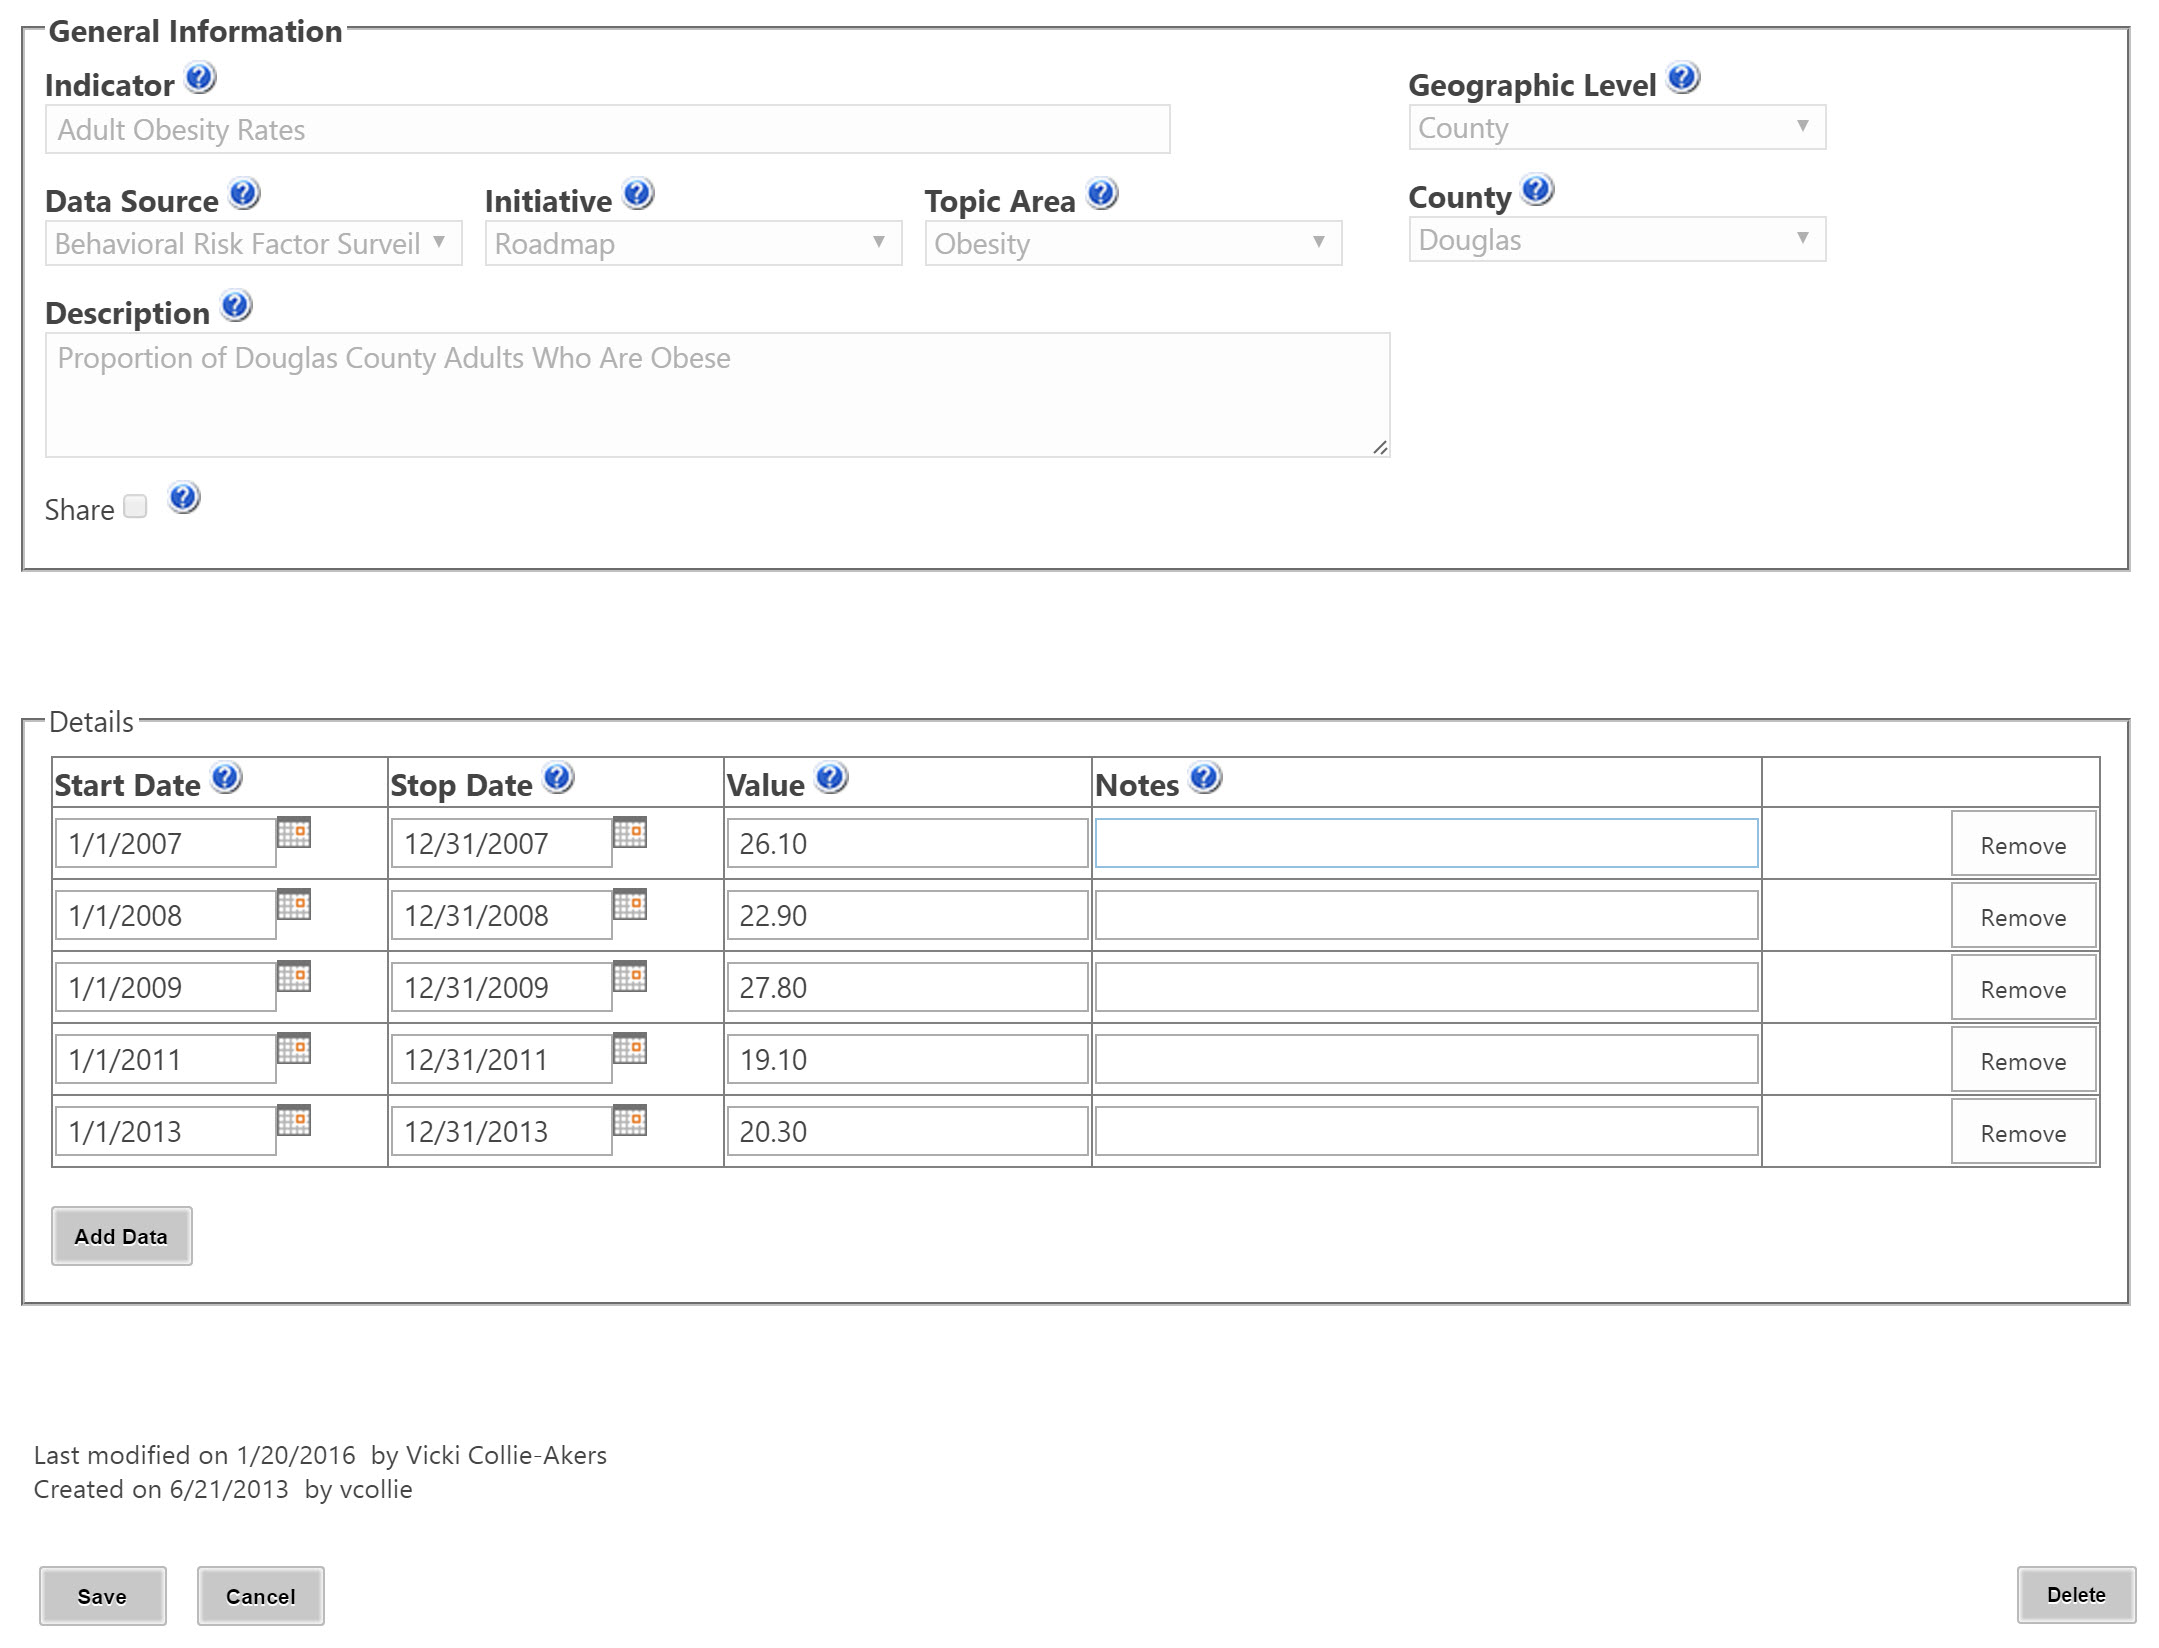
This will take you to the entry page for that specific Indicator. All of the basic information will have already been completed by your site Administrator, and will not be available to edit.
- Enter new information for
Start Date,
Stop Date,
Value, and
Notes.
- If you need to add more rows, click the
Add Data link at the bottom of the page.
- If you want to remove an entry from the Indicator, click the
Remove button in the corresponding row. Doing so will remove that specific row and the data in it.
- Once you have entered your data, click
Save. This will return you to the Indicator Management page.
If you decide not to make any additions or changes to the Indicator, you can click Cancel to leave the Indicator entry without making any changes and return to the
Indicator Management page.
NOTE:
Clicking the Delete button on the Indicator Management page will delete the entire Indicator, not just a row of data or data that has been entered during your session.
Only use the Delete button if you are absolutely certain that it should be removed from the site entirely. It is often best to check with your project lead before using the Delete button for an Indicator.
Edit Indicator Data
Users will rarely need to edit Indicators – Indicators that have already been created should have all relevant information already filled in. But if you have checked with your project lead and you do need to change or update any Indicator information, you can use the
Edit link next to the Indicator in the webpart or on the
Indicator Management screen.
This will take you in to the Indicator data entry page, but all the information will be available to edit.
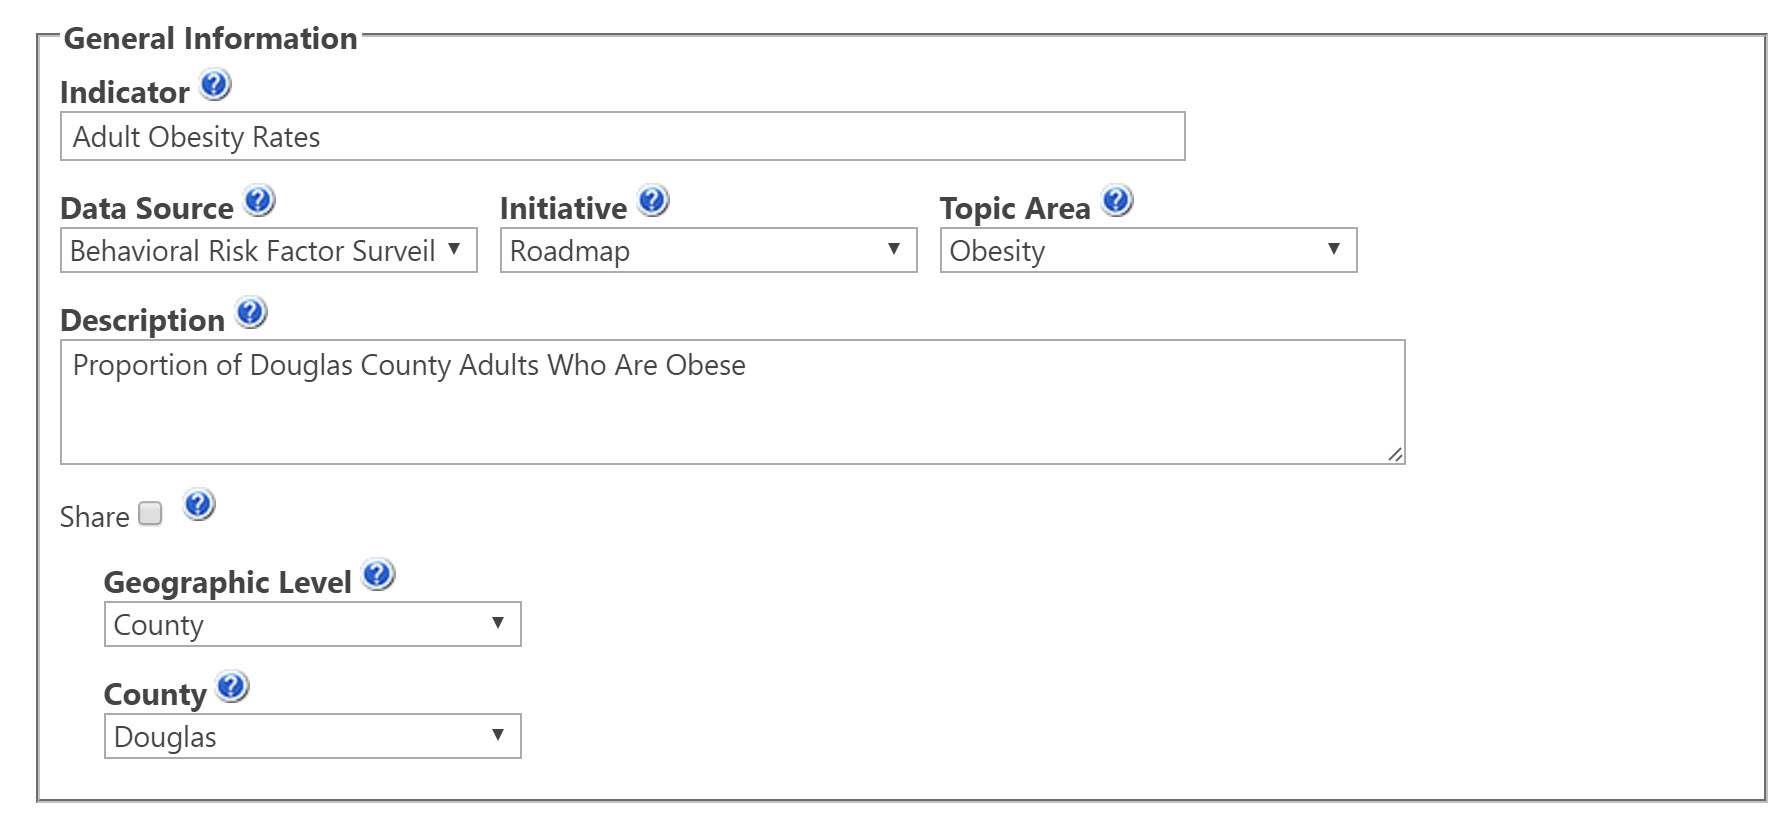
You can then make the necessary changes to any of the fields, and hit
Save.
It will most likely be rare that users need to edit existing Indicators – they should have all of the correct information already included, and if they already have rows of data with values, changing the details may invalidate that data that has already been recorded. If your Indicator has different information than is populated, it is possible that you might need to create a new Indicator. Before creating a new Indicator, double-check to ensure that an Indicator with all of your exact information does not already exist on the site.
Now that you have your indicator data entered, let's go learn how to turn it into a graph.
Note: Please review the
Graph Options information before you create a graph for the first time.
To graph Indicator data:
- Navigate to the
Graphs webpart on the main CCB page and click the
Create Graph link at the bottom. (If your site has buttons instead of webparts, choose
Create Graph.)
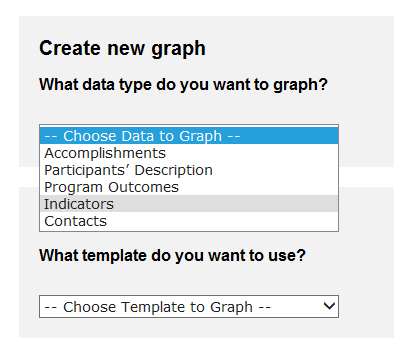
- In the Create Graph screen, choose
Indicators from the drop-down list of data to graph:
The Create Graph screen will refresh and offer you filtering options to determine exactly what Indicator Data you would like to graph.
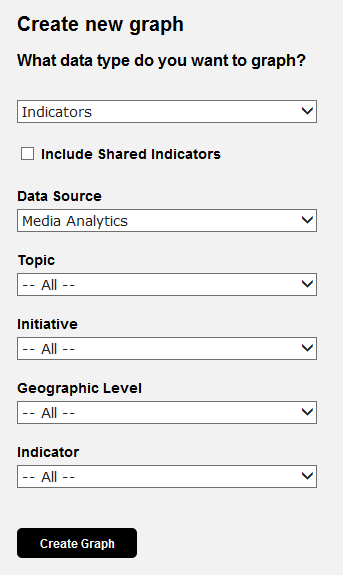
-
Once you have designated all of the filters you want to use, click Create Graph.
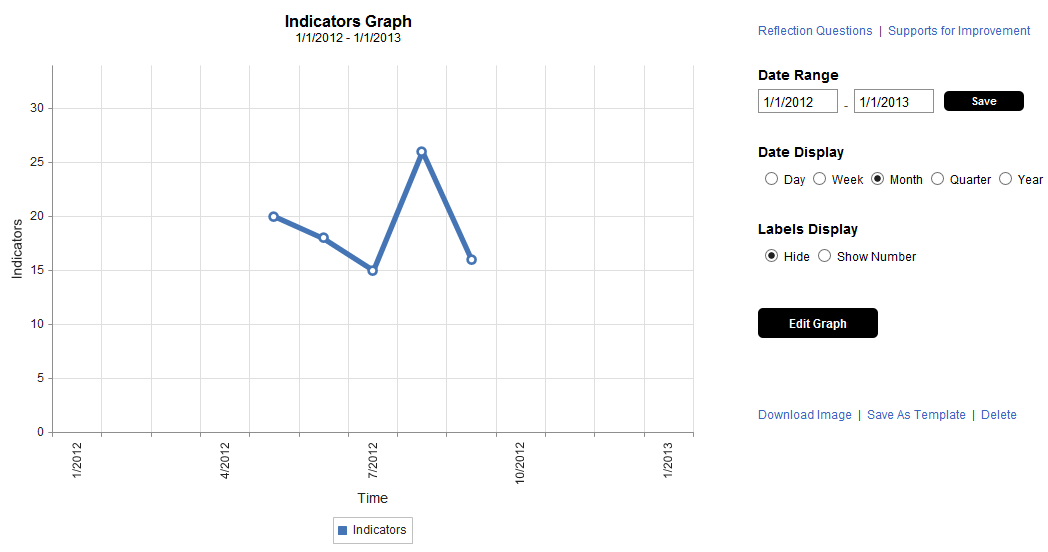
-
Edit the graph as needed by changing the Date Range, Title, etc. You also have the option to display the graph by Day, Week, Month, Quarter, or Year, depending on the timeframe by which your Indicator is measured. See more information on
creating graphs.
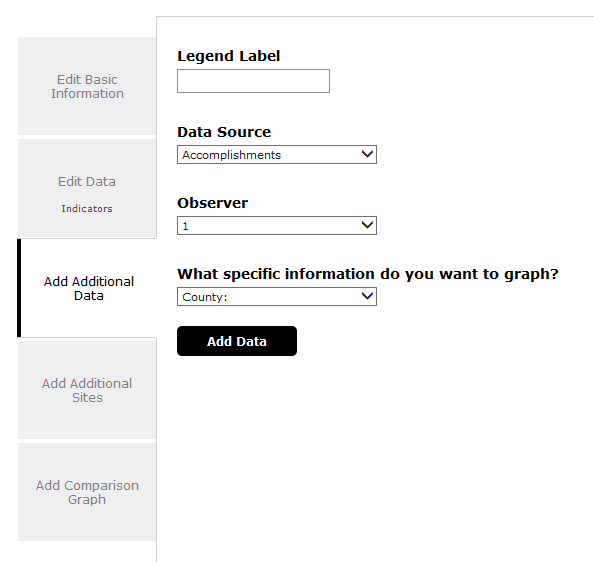
-
If you would like to add Accomplishments data to your Indicators graph, click the Edit Graph button. In the Edit Graph screen, click on the tab for Add Additional Data and choose Accomplishments.
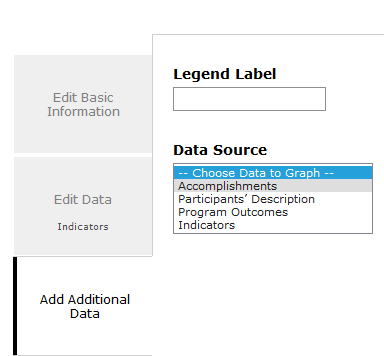
Once you have selected Accomplishments, the screen will refresh with options for that data, including a box to add a Legend Label, i.e. Accomplishments, and what specific Accomplishments data you would like to graph, i.e., Code.
-
Once you have made all of your selections, click
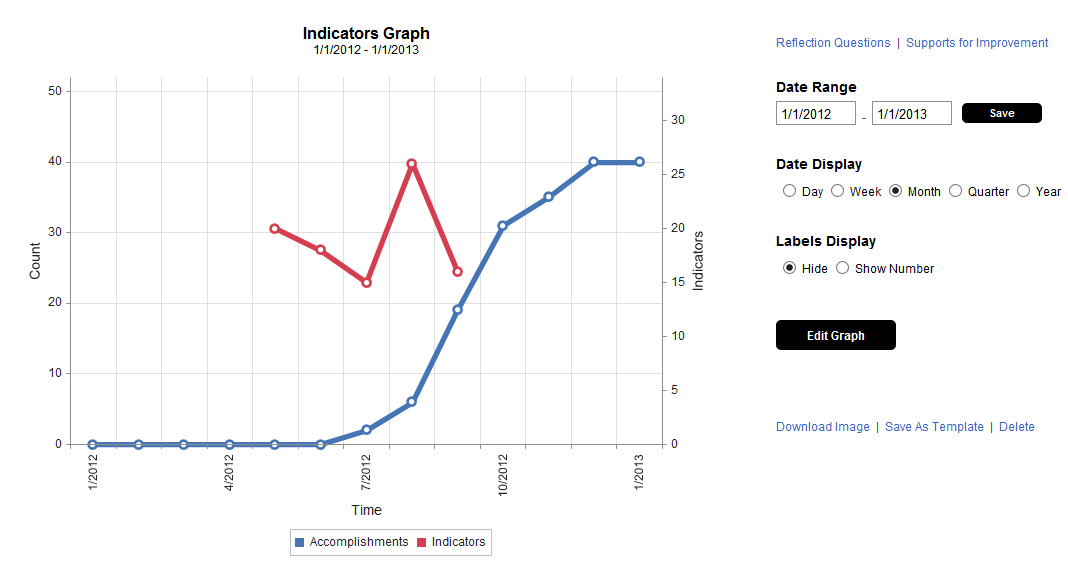
Add Data. You will then be returned to the graph which now includes both Indicators and Accomplishments data:
-
Select Update Graph if you want to save your changes and stay on this page. If you select Save & Go to Graph you will be returned to the graph display.
You can add Indicators data to an existing Accomplishments graph through the same process. Additionally, graphs that contain both Indicators and Accomplishments will have Reflection Questions tailored to prompt reflection on how the two data sets might affect each other, or what trends in each might mean for the other.
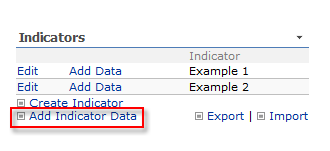
If you would like to export Indicator data into Microsoft Excel, you can do so either by clicking the Export link from the webpart.
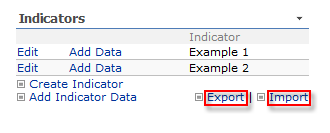
Or you can choose the Export link on the Indicator Management page:
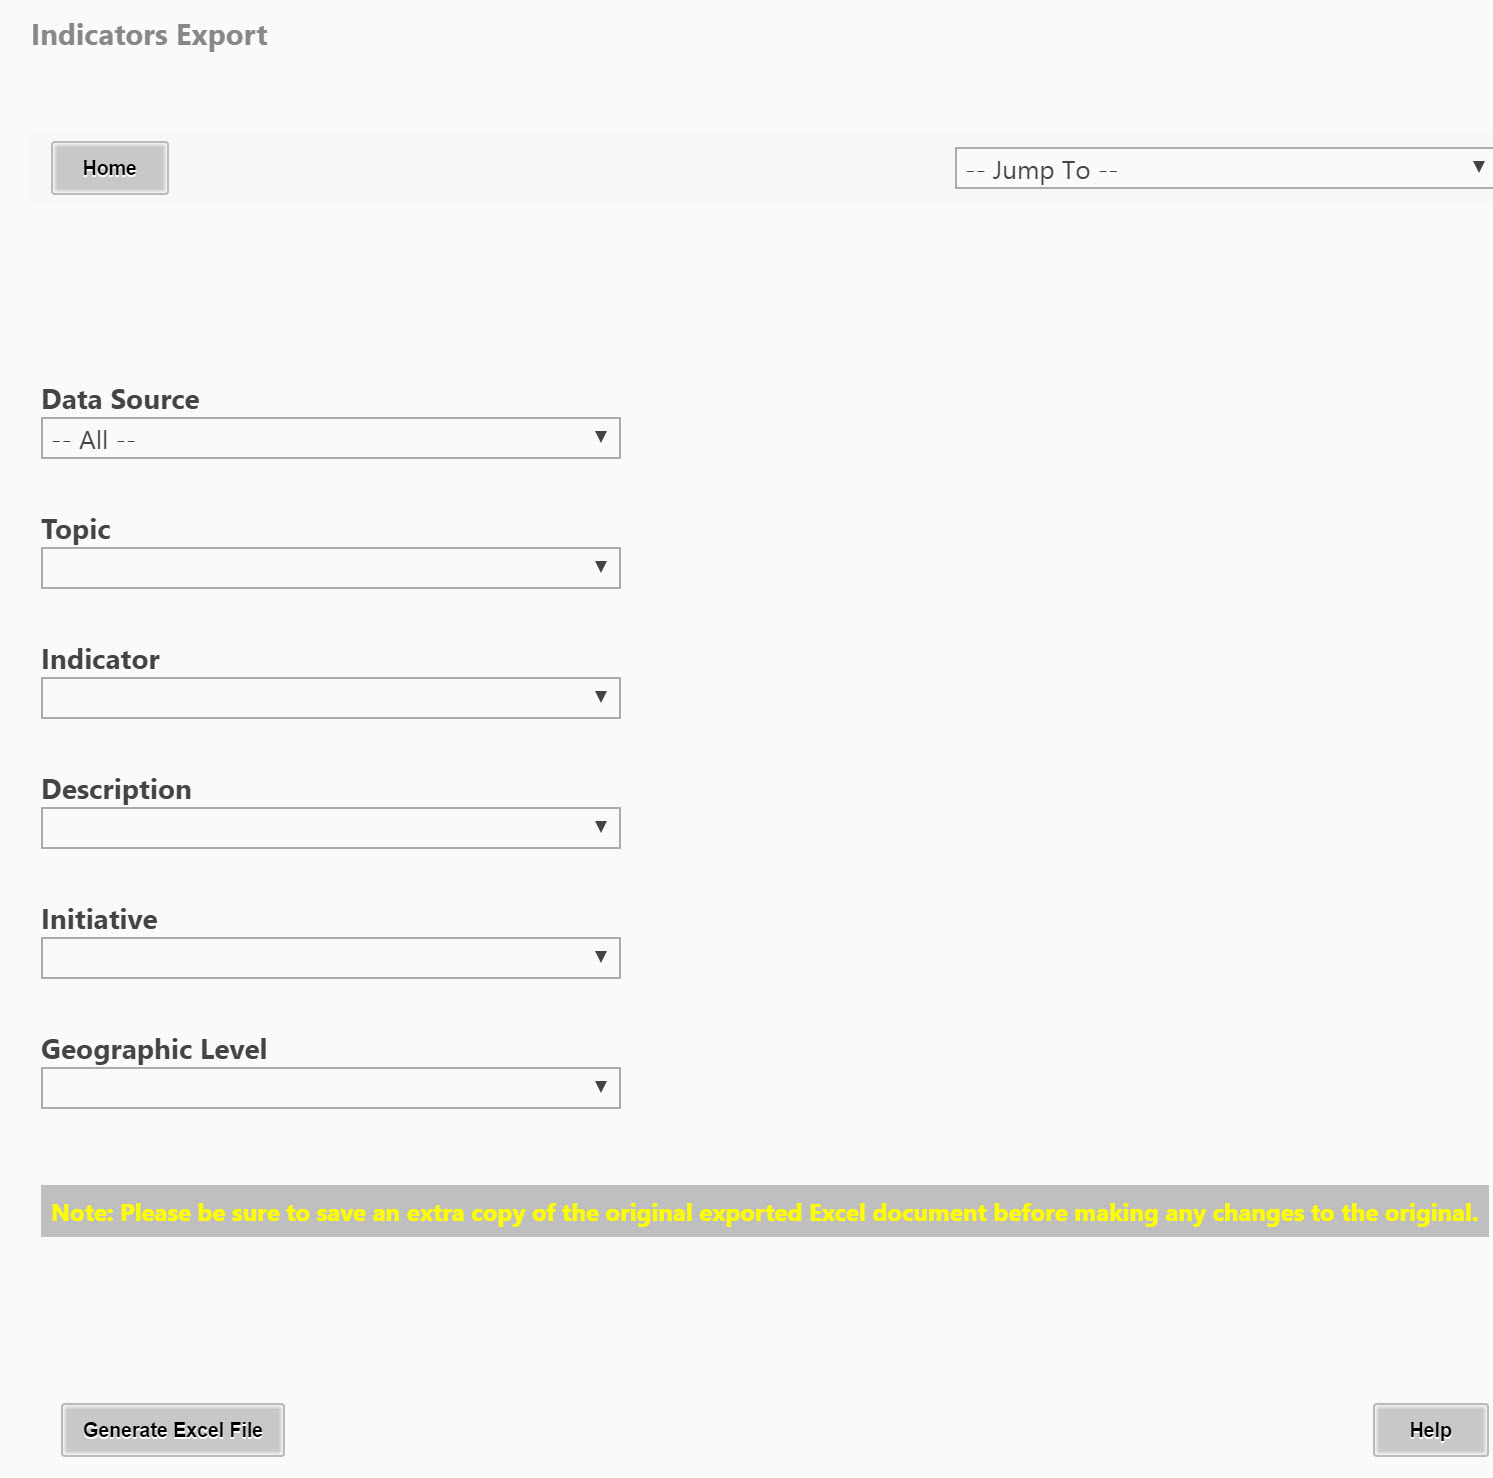
In the Export screen, you will be able to filter the Indicators by several different fields to determine what data is exported. Once you have set the parameters for the data, click Generate Excel File. The screen will display an "Export completed successfully" message and your export file will be automatically downloaded.
There may be some situations where you would want to import Indicator data, such as if you have exported data, and made updates to the information that you now want reflected in the system, or if you have a significant amount of data for several Indicators already collected, importing it from Excel might be more efficient than entering it manually for each Indicator.
Importing New Indicator Data
Indicator data is usually supplied by an external organization, governmental agency, etc. You need to import that data so you can use it to generate graphs and reports.
-
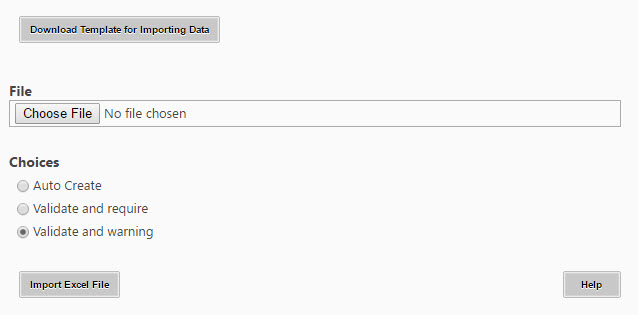
Click on the Import link on the webpart or the Indicators Management page (located right next to the Export link, pictured above). This will take you to the Import screen:
-
Click on Download Template for Importing Data to download an Excel document with the headers for all possible fields for entry. You must use this template in order to ensure that your Indicator data uploads correctly – the location of the information in the Excel document tells the system what box to put it in when it is imported in to the system.
-
It is important to ensure that the information you enter matches exactly with the choices available in drop-down menus in the Accomplishments data entry form. If the drop-down menu shows "Kansas" then "kansas" will not be recognized as a valid entry. Each choice must match exactly in capitalization, spacing, and punctuation, otherwise the system will not recognize it, and when you attempt to import, it will flag that data as an error.
-
Do not enter anything in the Indicator ID column – the system automatically assigns that value when it is imported.
-
Once you have put all of your Indicator data into the correct columns of the Import template that you downloaded, and ensured that it is all spelled correctly and that spacing and punctuation match the options already available in the system, save the document.
-
Once you have saved the document, click Browse, navigate to the file, and click Open.
-
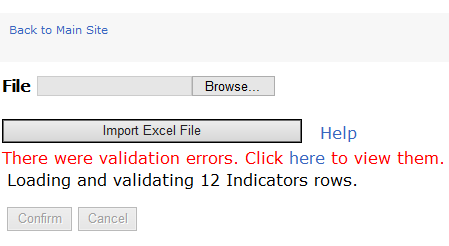
Once the correct file is displayed in the File box, click the Import Excel File button.
-
If there are any places where the data doesn't match, you will receive an error message:
-
If you receive this error message, click on here to open a pop-up box that will identify which rows have errors, and exactly what data is not recognized in those rows so that you can update your document. Once you have fixed the errors, save the document and go through the import process again.
-
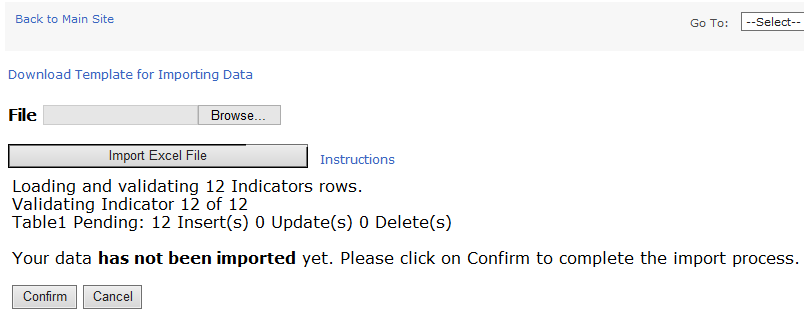
If there are no errors, you will receive this notification:
-
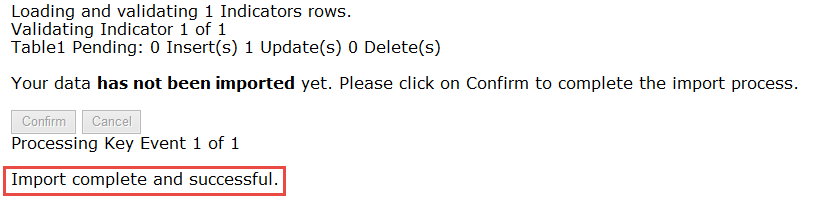
When you click Confirm, it may take some time for the import to finish, depending on the size of the file. Do not click the button a second time, or leave the page, as this will interrupt the import process. When your import is entirely complete, you will receive final confirmation below the Confirm button stating "Import complete and successful."
Importing an updated export
Be sure to keep the unedited version of the original export. You can use this to restore the original data if you encounter problems with the import.
NOTE: If you are importing for the first time and don't feel comfortable that you know what you're doing, check with your site administrator, or call technical support at the KU Work Group at (785) 864-0533.
Follow these instructions for your import:
- Create a copy of the original export.
- Open that copy and delete the first two rows (one says Indicators the other is blank).
-
Do not make any changes to the Indicator ID or column names.
-
Make edits to the data as needed.
-
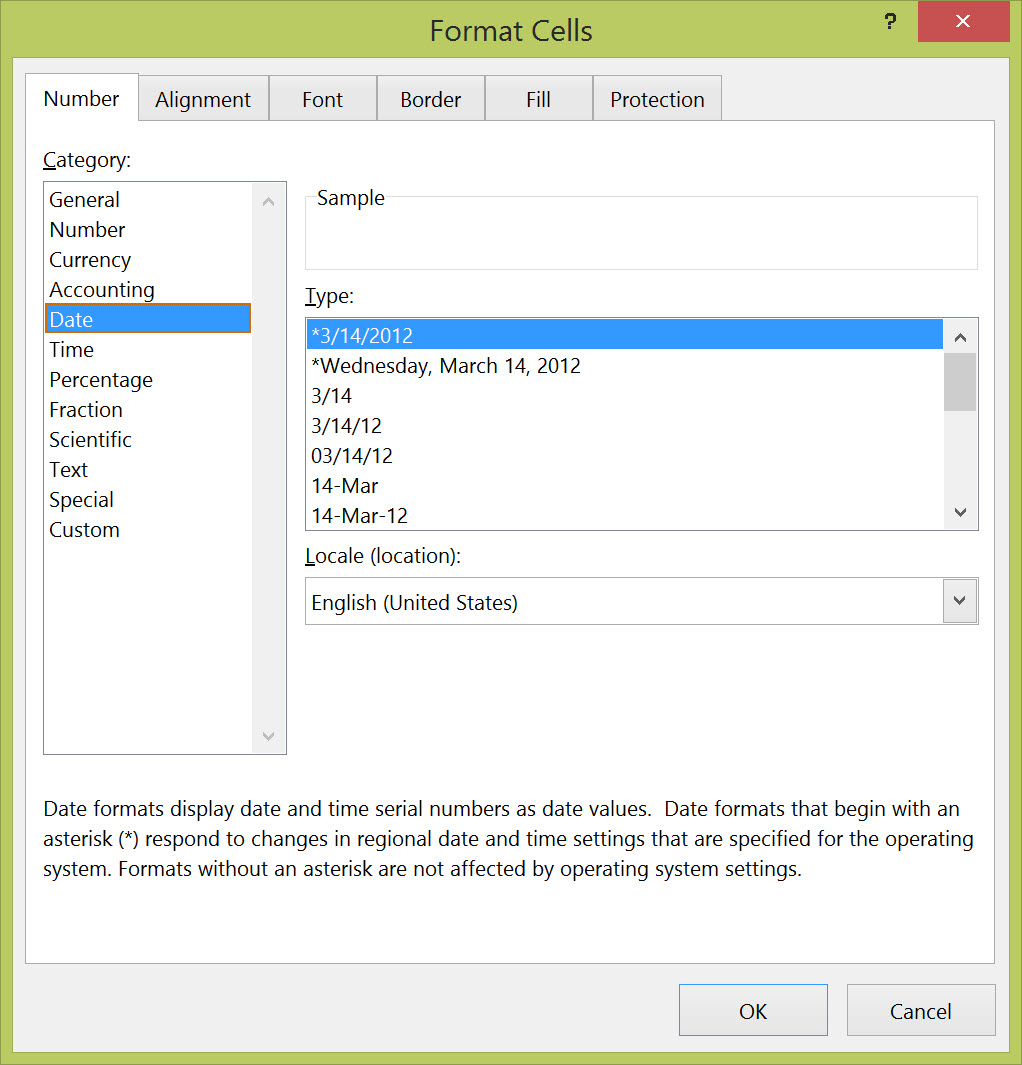
Select any data columns, right-click and select
Format Cells.
-
Select Date on the
Number tab, select the first option shown and click
OK.
-
Save and close your Excel document.
-
Follow the instructions for "Importing New Indicator Data" as shown above, but ignore steps 2 and 3.