⚠ This is an
archived version of our Community Check Box help documentation.
Please find our most up to date documentation at
Community Check Box Help.
Please Note:
- The Administration link can can only be accessed by KU Center for Community Health and Development staff and Site Owners.
-
Our staff are happy to assist Site Owners with any administration features.
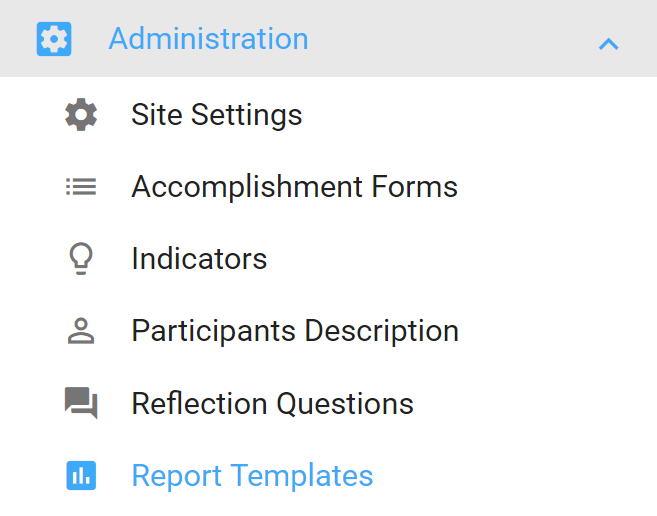
Administration for all CCB features are under the
Administration link in the left navigation bar. This page provides an overview of these features. Links to additional details are provided in some sections.
This is where you select settings that apply to the entire CCB.
-
Default Form - select CCB form that displays on the dashboard,
-
Default Code - select code that displays in the three graphs at the top of the dashboard.
-
Default Code Display As - change code name on dashboard graphs from "Community Changes (CC)" to "Community Changes.
-
Site Theme - select the site color theme.
-
Display Metrics - select whether the three graphs appear on the dashboard. We will turn this off for new sites that don't have any data yet.
-
Site Logo - upload site logo. Must be defined size. We already have all these logos created.
Our staff will work with you to create your initial CCB accomplishment form. You have the ability to make any needed edits to the form or, if you prefer, our staff would be happy to make those changes for you.
Here are the basic steps to create or edit an accomplishment form. Please see
Managing Accomplishments for detailed instructions.
- Go to
Administration >
Accomplishment Forms.
- Click on New. Otherwise, click on your existing form and then on Edit.
- Enable Accomplishment Flag, Secondary Scoring or Participant Description if you want to use those items.
- Add a new Section. Use the Display # field to place it correctly in the form.
- Add new Fields as needed and assign those fields to the appropriate sections.
Do not use quotes in the field names as this will cause a problem when you are exporting data.
- Set a Trigger as needed.
-
Save the form.
This is where you enter the options for indicators. You should be able to view any existing indicator options on your site. You can edit an existing indicator here. For additional information, or to create a new indicator, see
Managing Indicators.
- Go to Administration > Indicators.
- Click on a field name to select that item.
- Move the On Listing toggle to the right if you want that field to display on the indicator listing.
- Enter choices for that field in Choices.
- Move the Text line entry for other available to the right if you want to add that option.
- Add any Help text.
- Click Save.
- Repeat as needed.
If you want to track participant data, then Participants Description Enabled needs to be turned on the Accomplishment Admin Form. See step 2 under Administration - Accomplishment Forms above.
Create a new Participants Description Type:
- Go to Administration >
Participants Description.
-
Enter the
Type Name, e.g. Demographic.
- Click
Save.
- Click the Type Name you just created, and then click
Edit.
- Enter the Option (e.g. Gender).
- Enter a Display # to order the items.
- Move the toggle if you want to include New Participants.
- Enter the Choices (e.g., Male|Female|Unknown).
-
Save.
There is a default set of reflection questions applied to each new graph. To see those questions, go to an existing graph of the type you want to create (e.g., pie, bar, cumulative line), and click on Reflection Questions. The default reflection questions are all that most organizations need. Here is an example of default reflection questions for a bar chart:
1. What are we seeing?
- What pattern are we seeing in this distribution of activity?
- Which areas show more activity? Less?
2. What does it mean?
- What may have contributed to this pattern?
- What distribution of activities did the group intend, and how well did it meet it?
3. Implications for adjustment:
- Given what we are learning, what adjustments should we make (if any)?
- What specifically should we do to distribute activities as intended?
- What challenges need to be addressed to make needed changes? How can meet them?
If you need to add custom reflection questions, here are the instructions. Please be aware that the default questions will display along with any custom questions you add. Be sure to check out the existing default questions to make sure that you are not duplicating questions.
-
Go to
Administration > Reflection Questions..
-
Click
New to create a new question.
-
Enter the text you want to add.
-
Select the
Series Types (accomplishments, indicators, key events, etc.) associated with these questions.
-
Select the
Graph Types (pie, bar, cumulative line, etc.) where you want this new question to appear.
-
Click
Save.
Report templates allow you to create one template that can be used multiple times to create the reports your organization needs. If you create a monthly report template, then you, or your site users, can use that as your starting point each month. To run a report your site users will enter the date range, update text sections as needed, and then create a report. Please see
Report Templates for instructions on how to setup a report template.